Lsbcal
Give me a museum and I'll fill it. (Picasso) Give me a forum ...
I've updated my decades chart to add the current one, the 2020's. Hoping for a repeat of some past great decades. ")
The thick blue line is the current 2020's through April 2021. There are 10 other completed decades on this chart. I showed decades so that one could see how variable they have been and many of us think in terms of decades. Note this is inflation corrected data. Semilog charts help to show growth rates. A 7% growth rate is shown as a reference only. The solid think purple line is the 2010's that we have recently experienced.
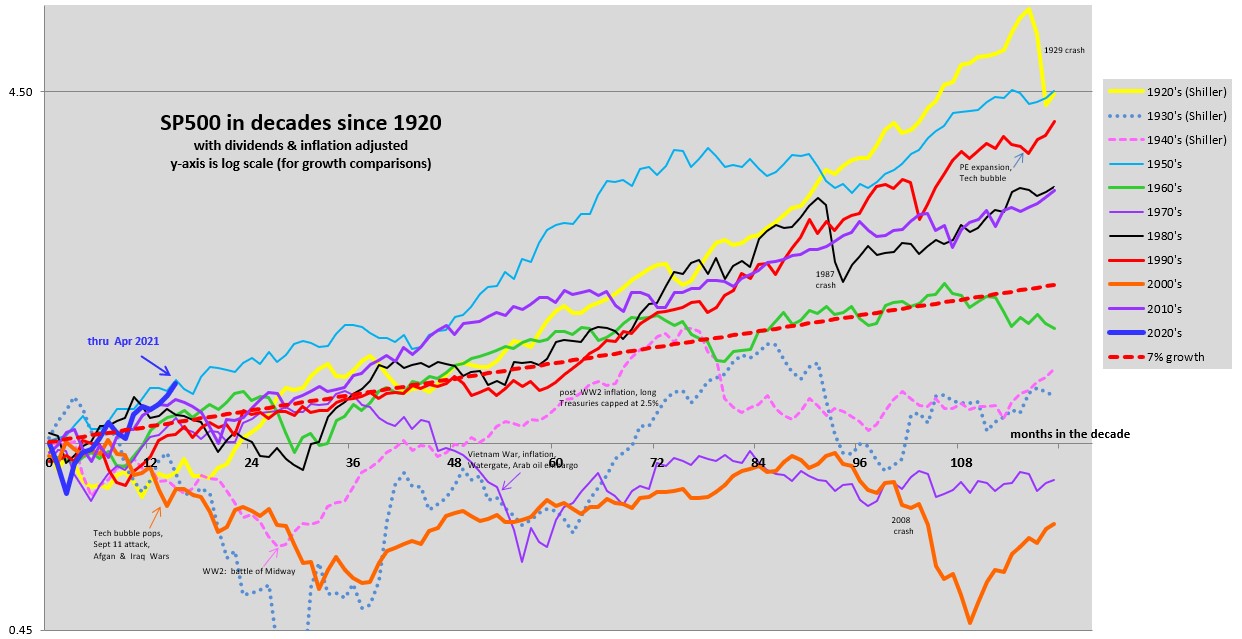
If the current market just followed a 7% rate from here it would be lower then some past decades but I would be a happy camper. I love things that go up and to the right.
The thick blue line is the current 2020's through April 2021. There are 10 other completed decades on this chart. I showed decades so that one could see how variable they have been and many of us think in terms of decades. Note this is inflation corrected data. Semilog charts help to show growth rates. A 7% growth rate is shown as a reference only. The solid think purple line is the 2010's that we have recently experienced.
If the current market just followed a 7% rate from here it would be lower then some past decades but I would be a happy camper. I love things that go up and to the right.

