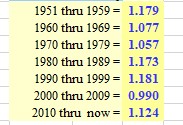
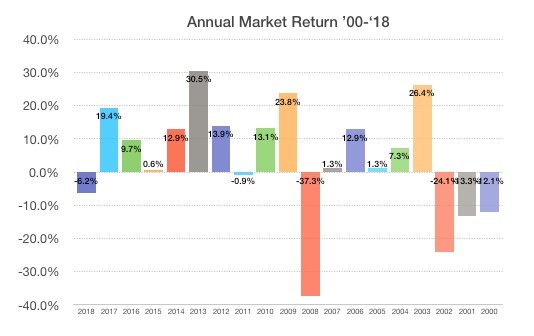
I have been running some long-term financial scenarios that required me to input a future average market return for my model. Looking at the past results was very surprising, and validated my assumptions about the last 20 years, especially given that most articles seem to think the average return is in the 8-10% range historically. I'm not sure whether to focus on the numbers or the chart. They give rather different perspectives on the average over time.
It looks like a 5% return would be considered excellent in this environment, but 2008 obliterated the average and it may not be as excellent as it seems. For now, I think I'll use 4% as my conservative average - half of the historical return - since my time scale is 40 years and it's impossible to predict anything out that far. I'd be interested to hear what number others use for long-term forecasting - or how you approach it over such a long term.
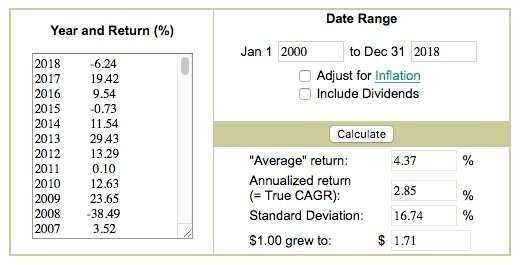
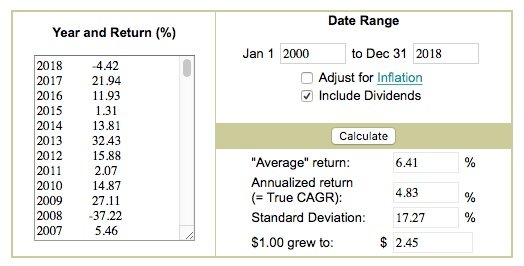
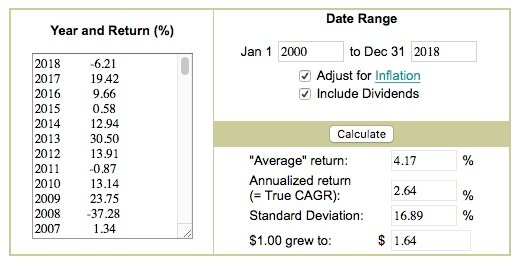
Here's the calculator: Annualized Return Calculator
The chart is mine, from the data on the website.
It looks like a 5% return would be considered excellent in this environment, but 2008 obliterated the average and it may not be as excellent as it seems. For now, I think I'll use 4% as my conservative average - half of the historical return - since my time scale is 40 years and it's impossible to predict anything out that far. I'd be interested to hear what number others use for long-term forecasting - or how you approach it over such a long term.
Here's the calculator: Annualized Return Calculator
The chart is mine, from the data on the website.
Attachments

Last edited: