523HRR
Recycles dryer sheets
- Joined
- Nov 24, 2011
- Messages
- 187
Gives perspective to fair share.
”A billion here, a billion there, and pretty soon you’re talking about real money.” -Everett DirksenThanks for the links. I had no clue how to find that info.
No wonder congress talks millions, billions etc. in spending.
Look at the top tax rate before the 80s:
https://www.wolterskluwer.com/en/expert-insights/whole-ball-of-tax-historical-income-tax-rates
The Tax Foundation is a biased organization, as can be seen in the bullet points spelled out in the first post in this thread, which are designed to create an emotional reaction of "the rich are being taxed to death" and/or "the poor are a bunch of freeloaders".
Well that is the beauty of the capitalist system. Everyone has a chance to make more.Looks like the 1% make WAY too much money compared to the bottom income people.
Yes, I found the endpoints in that article difficult to determine. I shall take a deeper dive into the Treasury report.The Treasury daily receipts show a much different set of numbers. Taxes collected fiscal YTD 2023 are higher compared with the same period ‘22, and taxes collected in the month of April are a bit lower. I don’t understand the numbers reported in the linked article but it looks like they may be referencing to taxes withheld on the on April 15 ‘22 vs April 17 ‘23
Until everyone agrees on the same operative definition of the word "fair" with regard to taxes, disagreements over the same data will persist.
Top rate doesn't mean much in a complex tax system with deductions and credits. I like to see the average rate of tax on the total income rather than marginal rate.Look at the top tax rate before the 80s:
https://www.wolterskluwer.com/en/expert-insights/whole-ball-of-tax-historical-income-tax-rates
The Tax Foundation is a biased organization, as can be seen in the bullet points spelled out in the first post in this thread, which are designed to create an emotional reaction of "the rich are being taxed to death" and/or "the poor are a bunch of freeloaders".
While I appreciate the gist of the original post, I'd be curious as to why 2020 was chosen as a year. It was an economic outlier, and despite personally thinking "the rich" pay plenty I'd bet that year they paid a higher than usual amount. I'm always suspicious of biased sources presenting facts, especially if they're facts I like.
Top rate doesn't mean much in a complex tax system with deductions and credits. I like to see the average rate of tax on the total income rather than marginal rate.
And if they could learn to LBYM....
Well that is the beauty of the capitalist system. Everyone has a chance to make more.
And no one gets to decide how much or little anyone wants to make.
And the income brackets are not static. People move in and out of them over time.
Could't agree more. I was born in a poor family near the bottom 1% of the "world" and now we are in the top 5% of US households (which I would presume will put us in the top 1% of the world). And by the way, LBYM allowed us to invest and be part of the capitalistic system. It was painful to make the tough choices (especially when all our friends and associates were spending like there is no tomorrow) to save now and spend later. IMHO people underestimate/ignore the power of compounding and don't want to practice delayed gratification.Yep, it’s America. I grew up lower middle class at best. Today we are in the top 2-3% and frankly proud to be there.
Could't agree more. I was born in a poor family near the bottom 1% of the "world" and now we are in the top 5% of US households (which I would presume will put us in the top 1% of the world). And by the way, LBYM allowed us to invest and be part of the capitalistic system. It was painful to make the tough choices (especially when all our friends and associates were spending like there is no tomorrow) to save now and spend later. IMHO people underestimate/ignore the power of compounding and don't want to practice delayed gratification.
As our salaries keep going up so does the tax bite. We cringe at every bracket bump but say to ourselves that we’re blessed to be earning more to pay more into the system. As mentioned in my other three, I am working towards simplifying my portfolio and need to find ways to reduce the tax bite during retirement. Our options are limited with W-2 earnings. Even after maxing out 401k’s, contributing to back door Roth and HSA’s we end up paying significant $$ in taxes. As others mentioned, I’ll gladly be in the top 1% paying 30%.
I’ve experienced the power of compounding and seeing daily fluctuations in 4 digits. Can only imagine what this looks like when the daily fluctuations are in mid- high 5 digits.
The fluctuations take some getting used. In the past on bad days or years, I would say to myself, wow we lost the value of a new car today or we lost the value of a new house this year. Now I just look at it as a percentage. It doesn’t feel so bad. It can also work in the opposite direction too.
Are you sure about that 30%?As our salaries keep going up so does the tax bite. We cringe at every bracket bump but say to ourselves that we’re blessed to be earning more to pay more into the system. As mentioned in my other three, I am working towards simplifying my portfolio and need to find ways to reduce the tax bite during retirement. Our options are limited with W-2 earnings. Even after maxing out 401k’s, contributing to back door Roth and HSA’s we end up paying significant $$ in taxes. As others mentioned, I’ll gladly be in the top 1% paying 30%.
I’ve experienced the power of compounding and seeing daily fluctuations in 4 digits. Can only imagine what this looks like when the daily fluctuations are in mid- high 5 digits.
Are you sure about that 30%?
For a married couple with $350k of ordinary income and $150k of preferenced income, federal income tax would only be 18.5%.
Even if you add Illinois state income tax of 4.9% that is 23.4%.
Add in SS taxes assuming ordinary income is wages and you get to 26.8%, still well short of 30%.
The only reason i mention it is because people quite frequently overestimate what they're paying for taxes.
The chart below assumes MFJ both under age 63, one earner, no dependents, no 401k or IRA contributions, no state tax, and a fixed $150K of qualified dividends. SS and medicare payroll taxes included.I was referring to when W-2 income increases to more than $400K and the highest tax bracket not the effective tax rate. Happy to stand corrected.
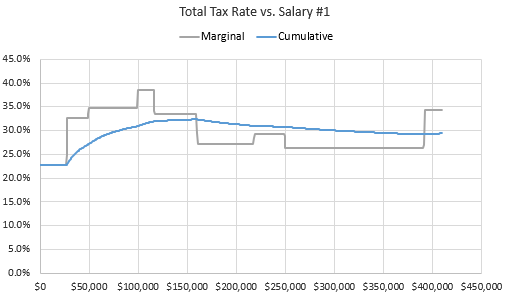
Nice chart SevenUp. It visually captures both the progressive and regressive aspects of the Federal tax system. I would like to see the same image decade by decade for the past 50 years. Couple those side by side by income distributions. Visuals are easier to grasp than lengthy descriptions.The chart below assumes MFJ both under age 63, one earner, no dependents, no 401k or IRA contributions, no state tax, and a fixed $150K of qualified dividends. SS and medicare payroll taxes included.
The case study spreadsheet (in Excel) used to generate the chart can generate similar charts with different assumptions.