Recognizing an historic crash vs. correction or bear market.

...

Where does the value of this simple model come? From avoiding the declines, and having lots of funds to invest at stock market bottoms. Look at 2009 you would be more than doubling your allocation to stocks based on this model. Data for the 1960's and 1970's will be interesting to see how this holds up.

Can you run the same data to show how a 60/40 or 75/25 with and w/o rebalancing would have compared? Or share your spreadsheet so we could take a shot at it with the same data?

Sometimes, the % declines are less because the run up was less.

edit/add: For example, your (simple, not weighted) average stock allocation during the raging bull of the 1990's was only 36.9%. That would have left an awful lot on the table compared to 75%.

-ERD50
 
Last edited:
Running_Man, thank you very much for posting your results. As far as changing my mind, though, your numbers don't move me much at all. I'm not certain I set up my spreadsheet correctly, so forgive me if my results are in error. However, I find that your PE10 market timing significantly underperforms buy and hold with annual rebalancing for the periods 1980-2013 and 1990-2013, but outperforms over the shorter periods 2000-2013 and 2007-2013. It's as I said earlier, if you get lucky and sell right before a market bottom, you win, but if you get stuck repeatedly selling into a big rally, you lose.

My results for 1980-2013 are calculated by maintaining the initial 75-25 asset allocation, rebalanced at the end of each year. My calculations indicate that a $100,000 investment on 1/1/1980 would grow to $3,677,960 on 12/31/2013. You are giving up a little over $630,000 in returns by employing your PE10 timing system, since you say you would have only $3,047,115 over the same time period with your system.

I do concede, however, that in exchange for inferior performance, you have significantly reduced volatility. Whether that's worth the sacrifice in returns strikes me as a matter of taste. I personally prefer to pick an asset allocation I'm comfortable with and stick with it, rather than obligate myself to make really large stock purchases at low valuations, when it's likely that the market has been tanking and no bottom is in sight. History has shown that this is the best time to buy, and your timing system takes advantage of this fact. It still doesn't make in psychologically any easier to do so in the real world, when the wisdom of buying stock depends on the complete unknown of relying on good future performance.
 
Last edited:
Hi Running Man, you did your analysis starting in 1980 and that whole period basically was a bond bull market with declining rates. So we would expect a bond heavy portfolio to do well. Back in 1980 that was not a popular view. Very few would have predicted such a sustained period of declining rates.

What is the constant AA that gives the same results? How did this compare to using Wellesley for the period (since Wellesley is a bond rich portfolio)?

I actually like to do this timing stuff. You may be on to something. I bet it could be optimized further.

P.S. I personally feel a cold wind blowing for bond heavy portfolios. But then I've always been a stock guy and came to fixed income kicking and screaming all the way. :)
 
Last edited:
One of the problems with the testing is taxes... not all people have a big amount in tax exempt accounts.... selling the big amount as indicated on 1/1/14 would be a big tax bill... over the years that adds up....
 
What I also find interesting is that if you had a million dollars invested this way for 2013 you would have had 350K in the S&P500 at 1/1/2013 and it would have been 463K by the end of the year and rebalancing would mean taking 188K out of stocks on 1/1/2014 and into bonds. Look at the talk on the boards at the start of this year, that would be an extremely unpopular move, yet at this point it would look extremely timely.
I view this comment as cherry-picking data to highlight the strengths of your system. If I'm reading your numbers correctly, at the beginning of 2013 you would have been forced to sell off much of your stock gains from 2012 plus an additional 3% to get down to your target allocation for 2013. We all know how that turned out - your bond purchases lost 2% last year and the stocks you sold to generate this loss would have returned 32%.

So you lost big in 2013 but have the edge so far this year. What does that prove except that PE10 market timing is extremely unreliable in consistently outperforming buy-and-hold?
 
Hi Running Man, you did your analysis starting in 1980 and that whole period basically was a bond bull market with declining rates. So we would expect a bond heavy portfolio to do well. Back in 1980 that was not a popular view. Very few would have predicted such a sustained period of declining rates.

What is the constant AA that gives the same results? How did this compare to using Wellesley for the period (since Wellesley is a bond rich portfolio)?

I actually like to do this timing stuff. You may be on to something. I bet it could be optimized further.

P.S. I personally feel a cold wind blowing for bond heavy portfolios. But then I've always been a stock guy and came to fixed income kicking and screaming all the way. :)

Seems like it might be nice to combine a PE10 with a similar bond indicator, maybe just the interest rate. That might hit a better balance than just PE10.

I'm happy with equity price drops as a buy indicator. Perhaps that could be combined with PE10 sells for a little better precision?
 
Excellent post!

I didn't react in time for avoid the 1999 dot com, new economy bust. Got out of the market right after 911, again late but avoided further declines. Got back in at the right time in 2002 and rode big gains. Moved from 100% equities to 100% a stable value fund in Aug 2008. Yep I timed the market perfectly this time. Just a few weeks before the big one. Got back into full equities in 2010 and rode big gains again.

Certainly I had no idea that 08 would turn out so ugly. But I did take action on how I felt at that moment. That is probably the biggest factor of all...taking action. That awareness or sense I attribute to having kept a close pulse on 3 key things since I was a kid in the early 80's: macro economics, the stock market behavior, and paying attention to what people are doing. In 2008 warning signs were going off all around me. Could not believe it when personally observed a 24 yr old espresso barista qualify for a $350k mortgage.

Yes I'm a market timer. I admit it. I like taking risks in life, but I'm not a big risk taker. There is a sweet spot.
I'm fortunate thus far that it has served me well.
 
Last edited:
I view this comment as cherry-picking data to highlight the strengths of your system. If I'm reading your numbers correctly, at the beginning of 2013 you would have been forced to sell off much of your stock gains from 2012 plus an additional 3% to get down to your target allocation for 2013. We all know how that turned out - your bond purchases lost 2% last year and the stocks you sold to generate this loss would have returned 32%.

So you lost big in 2013 but have the edge so far this year. What does that prove except that PE10 market timing is extremely unreliable in consistently outperforming buy-and-hold?
This is all true, I just find it interesting is the fact that the valuation is forcing you to sell in the middle of stock bull markets and buy at the end of bear markets. And not just small rebalancing positions, this is large changes to portfolio composition.
 
Hi Running Man, you did your analysis starting in 1980 and that whole period basically was a bond bull market with declining rates. So we would expect a bond heavy portfolio to do well. Back in 1980 that was not a popular view. Very few would have predicted such a sustained period of declining rates.

What is the constant AA that gives the same results? How did this compare to using Wellesley for the period (since Wellesley is a bond rich portfolio)?

I actually like to do this timing stuff. You may be on to something. I bet it could be optimized further.

P.S. I personally feel a cold wind blowing for bond heavy portfolios. But then I've always been a stock guy and came to fixed income kicking and screaming all the way. :)
I will continue to work on this
 
And not just small rebalancing positions, this is large changes to portfolio composition.
In this sense it is identical to any other market timing scheme - you end up making big bets on the future direction of the stock market. If you're lucky, you win big. If you're unlucky, you lose big. And as is also typical of market timing schemes, it fails to outperform buy and hold over the long run. If you want to make big bets that will probably backfire on you, then PE10 market timing is worth considering.
 
In this sense it is identical to any other market timing scheme - you end up making big bets on the future direction of the stock market. If you're lucky, you win big. If you're unlucky, you lose big. And as is also typical of market timing schemes, it fails to outperform buy and hold over the long run. If you want to make big bets that will probably backfire on you, then PE10 market timing is worth considering.
Not necessarily. Eyeballing the data RunningMan presented it looks like volatility is considerable lower. This might lead to a greater probability for portfolio survival, which is more important than yearly return once you are in the withdrawal phase.
 
Not necessarily. Eyeballing the data RunningMan presented it looks like volatility is considerable lower. This might lead to a greater probability for portfolio survival, which is more important than yearly return once you are in the withdrawal phase.
I agree that overall PE10 market timing reduces volatility when compared to buy and hold. And in particular, I think that it greatly reduces market risk at high PE10 values. I can't speak for him, but I strongly suspect that this is why someone like our fellow member haha swears by it and appears to have taken action to implement his personal version of PE10 market timing. Good for him, and I hope it works out well.

I don't agree, though, that as a general rule PE10 timing increases portfolio survivability. What I think an analysis of the data would show is that you get improved survivability at high PE10 values, but probably worse survivability when PE10 is low. In a market crash situation, the typical retiree is likely to be locked into a timing system that could force him to go from 25% stocks to 75% stocks in just a year or two. The hope is that "over the long run" the low valuations will translate into higher returns. But what if "over the long run" means many years down the road and stocks continue to fall after our unfortunate retiree has committed 75% of his portfolio to them? He is out of luck. He has placed his trust in a market timing mechanism that forces him to expose the money he is relying on to fund his retirement to the whims of the stock market.
 
Last edited:
I think that there are times that valuation is so out of wack that it makes sense to lighten up on stocks. The stock bubble of 1998-2000 was one such time. When PEs of large companies start approaching 50 it is pretty clear that there is no way that a basket of them is going to provide acceptable long term returns.

I remember ending up with a lot of cash in '99 because I would look at the stocks I owned and ask "how is this company going to earn enough money to justify this valuation?". If you can't come up with even a longshot scenario that justifies the price, then it makes sense to sell.

That is the only time I ever felt that the market was that out of wack though. I started the latest market crash fully invested and stayed fully invested. I have a little cash now, but I have it because my situation requires a slightly more conservative asset allocation, not because I think valuations are out of wack.
 
I calculated what would have occurred if one had a 75/25 SP500/Bonds vs the Schiller from 1980, 1990 and 2000 with a withdrawal rate of 4%.
With a starting portfolio of $100,000 and $4,000 withdrawn at the start of the year the results at the end of 12/31/2013 would have been:

YEAR _ SCHILLER __ 75/25 _
1980 $1,562,743 __$1,906,914 _________$12,840 Withdrawal for 2014
1990 $__316,222__$_409,864 __________$7,520 Withdrawal for 2014
2000 $__126,967__$__70,131 __________$5,593 Withdrawal for 2014

At this point I do not propose that anything has been proven, only some interesting data. What it does prove is 1980 would have been a nice year to retire, could do whatever you want to at this point! As has been pointed out the last 2 years has allowed the 1980 & 1990 portfolio to pull ahead. At 1/1/2012 the portfolios were virtually tied, but Schiller is still showing overvaluation at this point, but investors are disagreeing.

I will compare versus Psssssstt... and work on the 60's and 70's next PEACE!
 
I'm not sure I understand your presentation Running Man.

It would be best to show a semilog chart to compare two separate schemes. That way it is easy to see periods of out and under performance, i.e. one just looks at the convergence and divergence of the lines. That is what was done in the market timing thread mentioned above: Market Timing Models .

Also another way is to give CAGR's for various time periods.
http://www.portfoliovisualizer.com/TestMarketTimingModel
 
I agree that overall PE10 market timing reduces volatility when compared to buy and hold. And in particular, I think that it greatly reduces market risk at high PE10 values. I can't speak for him, but I strongly suspect that this is why someone like our fellow member haha swears by it and appears to have taken action to implement his personal version of PE10 market timing. Good for him, and I hope it works out well.

I don't agree, though, that as a general rule PE10 timing increases portfolio survivability. What I think an analysis of the data would show is that you get improved survivability at high PE10 values, but probably worse survivability when PE10 is low. In a market crash situation, the typical retiree is likely to be locked into a timing system that could force him to go from 25% stocks to 75% stocks in just a year or two. The hope is that "over the long run" the low valuations will translate into higher returns. But what if "over the long run" means many years down the road and stocks continue to fall after our unfortunate retiree has committed 75% of his portfolio to them? He is out of luck. He has placed his trust in a market timing mechanism that forces him to expose the money he is relying on to fund his retirement to the whims of the stock market.
All interesting points. I think the most practical objection to PE10 market timing is seen today. By PE10 we are obviously pretty far extended, yet equities are on a tear. I takes grit to sell positions that are going up daily, especially after the experience of the late '90s when we saw just how wild this can get. People tend to think that their superior expertise will allow them to stay until the music stops, then and only then to exit ahead of all the others.(Sometimes derisively called the masses.) I figure we are all the masses, only those of us attempting market timing are the market timing masses. I put essentially no faith in optimization. Within the bounds of my desire to pay LTCG taxes, I will use this kind of crude market valuation timing, but since most of my investments are taxable, it could never really become 25:75.

I tend to think that those of us who make some strategic sales at these levels will not have to wait too long to be glad we did, but it is much less that a dead cert that this will happen.

Anyway, market timers and buy and holders are not really in direct competition with one another, so may we all be satisfied.

Ha
 
Lsbcal,
I agree with your critique of the presentation, it certainly is not user friendly yet, I am going to put this together over time if it continues to be as interesting as it appears to be to me. I hope to improve the visuals, but as a numbers guy I am finding the base data fascinating in potential.

There were 14 times in the past 86 years where the model suggested stocks should be under weighted by this model to 30 percent stocks or less. All but 2 have been since 1996, 6 of those 14 occasions have been a negative year for stocks.
Sounds like there may be a lot of recency in this approach. The bond rate decline won't be like 1996 to present when 5 year Treasuries went from 5.3% to 1.5%, i.e. we cannot go down another 4%. Also PE10 is a pretty recent popular discovery. Not as bad as Gazarelli in the post-1987 years but certainly has a lot of admirers. Their are a few naysayers though.

So something to consider when marrying any particular methodology and/or AA ... whether that is MT or buy-hold.

I don't know if there has been a bad sustained stock market when the Fed has been so loose with a highly sloped yield curve. Corrections yes, but many months of poor returns, probably not.
 
Last edited:
What always scares me with any market timing scheme, no matter how "sophisticated" is the extraordinary opportunity for human error. Behavioral biases abound in the market. I have to ask, who could be arrogant enough to think they're smarter than the market, an amalgamation of the best and brightest? It's a dangerous road to travel, one littered with ghosts of the financially ruined.

For hundreds of years, in countries all over the world, again and again, in every kind of wild human get rich scheme imaginable some very wise and talented people have convinced themselves they could beat the market. Sometimes they're lucky, but as they say, even a stopped clock is right twice a day. Too, too much research, too, too much history, and even a plethora of posts on this board and others evidences people who won big only to later regret/hindsight/if only.

Predictions are noise, speculation, distracting at best. Who was it that said there are two kinds of economists (?), those that don't know and those that don't know they don't know. I'm no economist, but I know that I don't know.
Just thought I'd highlight the words I find a little too hard to swallow. Maybe you didn't mean to be so negative? :)
 
I think there are different kinds of market timing strategies. All too often, it is "hey, stocks were up big last year. I'm going all in". But, personally, I think that a market timing strategy based on valuation is very unlikely to send you to the poor house (though you may very well leave some money on the table).
 
Last edited:
I think that there are times that valuation is so out of wack that it makes sense to lighten up on stocks. The stock bubble of 1998-2000 was one such time. When PEs of large companies start approaching 50 it is pretty clear that there is no way that a basket of them is going to provide acceptable long term returns. ... .

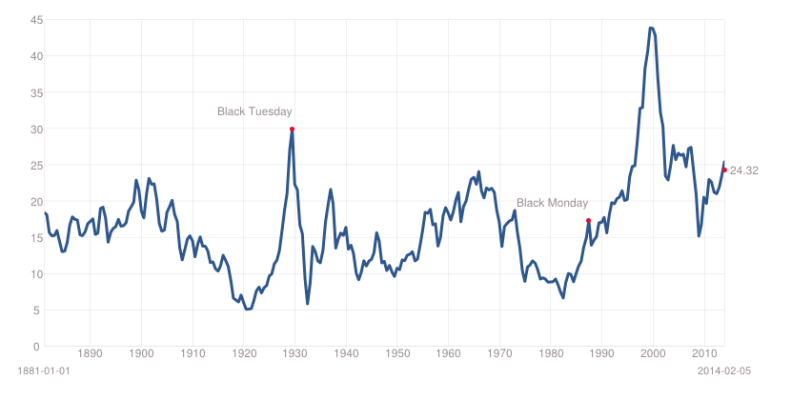
But the problem with this, it is kind of a rear-view mirror look. Sure, 'approaching P/E of 50' is a pretty clear sign that there can't be much upside, but on the way there, you went through PE20 (historically pretty rarefied territory), and then PE25 (surpassed only by the Black Tuesday run-up!), and then PE30 (the absolute PEAK before Black Tuesday crash - so are you shooting for timing this to PERFECTION, expecting history to repeat itself exactly!?), and then PE 35 and 40 before 'approaching 50'.

If you held on into '99, then you held on through unprecedented levels of PE. I would think anyone using this as guide would have been out far sooner, and missed a lot of gains (enough to more than make up for the drop? I don't know, the numbers will tell us that).

Now, If I played Rip Van Winkle, and woke up after sleeping for 20 years, and saw that the Schiller PE was above 40, yep, I'd do some major selling. But if I were awake and followed this, I would have been easing out along the way. That might or might not work out.

-ERD50
 

Attachments

  • Schiller-PE10-graph.png
    Schiller-PE10-graph.png
    48 KB · Views: 20
Just thought I'd highlight the words I find a little too hard to swallow. Maybe you didn't mean to be so negative? :)

I think "scheme" in the very first sentence deserves to be highlighted. (Up until your post I thought that I wouldn't be able to be a valuable contributor to this thread).
 
But the problem with this, it is kind of a rear-view mirror look. Sure, 'approaching P/E of 50' is a pretty clear sign that there can't be much upside, but on the way there, you went through PE20 (historically pretty rarefied territory), and then PE25 (surpassed only by the Black Tuesday run-up!), and then PE30 (the absolute PEAK before Black Tuesday crash - so are you shooting for timing this to PERFECTION, expecting history to repeat itself exactly!?), and then PE 35 and 40 before 'approaching 50'.

If you held on into '99, then you held on through unprecedented levels of PE. I would think anyone using this as guide would have been out far sooner, and missed a lot of gains (enough to more than make up for the drop? I don't know, the numbers will tell us that).

Now, If I played Rip Van Winkle, and woke up after sleeping for 20 years, and saw that the Schiller PE was above 40, yep, I'd do some major selling. But if I were awake and followed this, I would have been easing out along the way. That might or might not work out.

-ERD50
There is no doubt that everything you say is true. Is anyone disputing this?

Popular childhood games like musical chairs and others teach children this very fundamental human understanding needed to thrive in our competitive society.

It's a case of pay your money, and take your choice. Right now I am spending a fair amount of money on option time decay. This may or may not be intelligent, but it is certainly a reasonable cost given my goals and constraints, and the choice is mine.

Ha
 
Last edited:
...
Popular childhood games like musical chairs and others teach children this very fundamental human understanding needed to thrive in our competitive society.

Ha
I missed musical chairs in childhood. We just played cops and robbers, "bang, bang, your dead!". Sounds a bit like the stockmarket, don't you think. ;)
 
Back
Top Bottom