- Joined
- Nov 27, 2014
- Messages
- 9,254
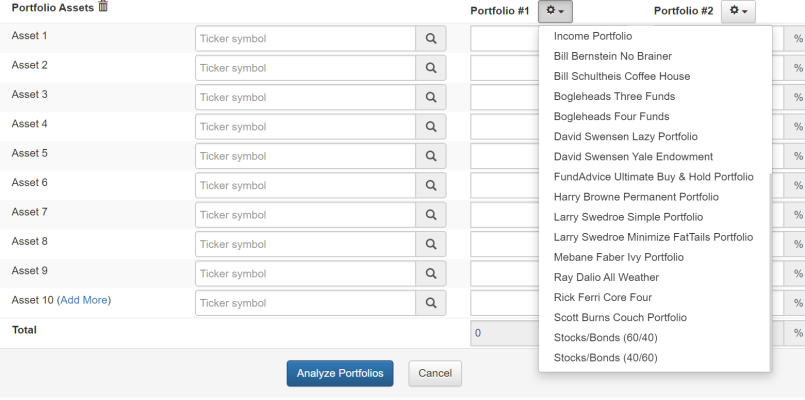
How can I get a good number to evaluate my performance against a 40/60 portfolio? I’m just over 5% for the year, but my benchmark is a 40/60 portfolio and I’d like to know what that is YTD. Also will be looking for the same thing at year end and going forward so I’m looking for a good source.