Returns year to date

I shouldn't be posting here, because DW and I are ultra risk averse. Our retirement nest egg is in Susan Anthony dollars, buried in coffee cans in our back yard. The balance is in 30 year IBonds which we bought from 2001 to 2003, and a few longer term CD's (under 5%).

America's Best Kept Financial Secret: I Bonds | PBS NewsHour
(note: the article talks about a $10K/person limit. When we invested it was $30K/person it was $30K/person)

edited to add: After comparing the past ten year return on our IBonds, it appears that it beats the DJIA... 6% to 4%.

Have been very nervous since 2009 when a good friend watched as his retirement fund lost $400K, and yes, he has recovered about 80% of that.

...Still, at this time, we feel relatively safe with our existing capital, and at our age, feel no great need to try and make more. We weighed the risk-reward, and decided to go with our comfort zone.

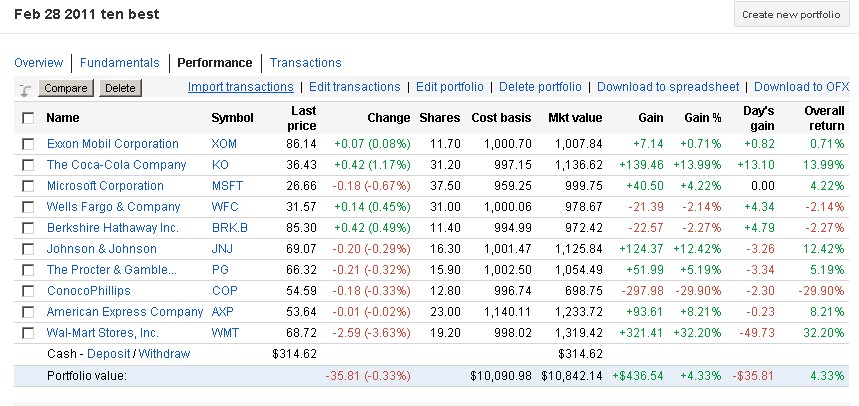
That said, watching the market as a fly on the wall, last year, after reading one of the gurus on Motley Fool speak to long term "safety" in the market for risk averse investors, I took his recommended 10 safest stocks, and created a portfolio to watch. Here's the result, from February 12 2011, to November 15, 2012. a 4% return.

img_1248672_0_21f499f1c9f8b8b3e691e5def4ee1f9b.jpg


This probably doesn't belong on the thread, but thought you might be interested in the kind of thinking that is extant in the minds of many older retirees with limited reserves, who have a shorter investment horizon. Not a recommendation, just an observation.
 
Last edited:
imoldernu, from the calcs that you have shown it loos like the return doesn't include dividends (which would increase the return) and is for 21 months (which would decrease the return if converted ton an annualized return.

I just realized one thing. Do the numbers above also include the amount of money saved this year or just the interest on the total invested assets as of last January ?

In my case it is the internal rate of return on my investment portfolio given the beginning market value, cash flow (additions, withdrawals, interest, dividends, etc) and ending market value; then converted to an annualized rate. It is off the Investment Performance report in Quicken.
 
The values presented here appear to be just great, taking into consideration that DowJones only made about 0,3% since January 1st!

Congratulations!
 
The values presented here appear to be just great, taking into consideration that DowJones only made about 0,3% since January 1st!

Congratulations!

That seems too low so I looked it up. This says 5.15% YTD.

http://quicktake.morningstar.com/index/IndexCharts.aspx?Country=USA&Symbol=$INDU
 
7.2% on my Fido 401K year to date (through 11/15). AA is about 60/40. But who knows -- the way the last two weeks have gone, 2012 could wind up being a negative year when all is said and done.
 
My Roth YTD return:
as of 9/30/12, 13.83%
as of 11/15/12, 10.07%
This account is Growth, 45%, Growth & Income 36%, Equity-Income 15%, and Balanced 4%.

My 401K 1 yr return:
as of 11/15/12, 10.7%
all in Vanguard Target 2045. Which is 90% stocks 10% bonds.
Even though I'm hoping to be out around 2027.

Those sound pretty good.

My annualized since 2003 return in my Roth is 5.74%. I remarked in a post a month or two ago that I thought this was "pathetic." But it turns out it was just normal. I think.
 
I just realized one thing. Do the numbers above also include the amount of money saved this year or just the interest on the total invested assets as of last January ?

You probably get a little of everything -- some making contributions, some taking distributions, some doing both, some giving true YTD numbers, some giving annualized YTD numbers, some that are not sure, but they see a number on Quicken or a brokerage display and just use that.

Us, we are up almost 10% after taking enough to pay some bills and not making contributions.
 
Ok. Just to clarify, my number excluded money saved this year.
Rustward said:
You probably get a little of everything -- some making contributions, some taking distributions, some doing both, some giving true YTD numbers, some giving annualized YTD numbers, some that are not sure, but they see a number on Quicken or a brokerage display and just use that.

Us, we are up almost 10% after taking enough to pay some bills and not making contributions.
 
My results are net of withdrawals (I'm in draw-down phase)

As of today, IRR is 7.1% ytd.

AA as of today is 35/53/12 (I classify i-Bonds as cash)
 
with the newsletter we follow the growth model which was 7 points ahead of my 97% fixed income model is now only 1% ahead of my model.

9.5% for the growth vs 8.5 for my fixed income model.

boy i love it when i feel like a genius.
 
I haven't ckecked it out. I see I still haven't hit any rebalance point for my AA so it couldn't be too far off from the last time I checked in June. Anyway I can't spend percentages so maybe I'll take a peak at the balances.
 
I just realized one thing. Do the numbers above also include the amount of money saved this year or just the interest on the total invested assets as of last January ?

The OP asked for 'returns', which means gains/losses net of deposits/withdrawals. We can't know if some people reporting here have followed that definition, unless they specified.

Including deposits/withdrawals, the question should be "How has your net worth changed YTD?" - but that isn't a useful number if you are trying to compare investments, as the OP is.


I shouldn't be posting here, because DW and I are ultra risk averse.
I am pleased to read that I am not the only one to be totally risk averse around here.

You should be aware, there is a big difference in age between imoldernu(hint: imoldernu=I'm-Older-Than-You) and obgyn65. Many people would consider his AA to be appropriate for his age, but not for a younger person. Apples-oranges.

-ERD50
 
Per Quicken, YTD return thru 11/16/12 is 9.2 %. I certainly liked the results as of Audreyh1's 9/14 date better - 15.6%. As a side note, I momentarily went over my equity allocation band of 55% back then but being the naturally lazy person I am, decided to wait until it REALLY went over the upper limit. Well, now equities are back down to 54%, safely within my 45-55% band. Back to sleep now I guess.
 
Return

7.7% as of the 16th. (50/27/23 cash). May put 5% of the cash to work over the next 2 months.
 
Below is chart of Year-to-Date (to Nov 17, 2012) returns reported by a number of balanced and target retirement funds. The chart is return versus percentage of fixed income in the funds. Presumably the reported returns assume one held their shares since December 31st of 2011.
x1el9c.png


So one's return depends on one's allocation to equities and fixed income.

Also one can report returns for one's entire portfolio or just an account. For example, our entire portfolio including any "cash" in money market accounts and sweep accounts has an 8.4% return in 2012 according to MSMoney which uses XIRR() algorithm for a current AA of 55% stocks. But my 401(k) has a return of 9.5% with only 46% stocks. Or my Roth IRA is up 12% with 100% stocks.

These returns are inline with the chart.
 
The OP asked for 'returns', which means gains/losses net of deposits/withdrawals. We can't know if some people reporting here have followed that definition, unless they specified......

+1 I think that "return" is commonly viewed as the internal rate of return that equates the ending portfolio value to the beginning portfolio value +/- cash flows during the period (the XIRR function in Excel). In other words the discount rate that equates the cash flows and ending portfolio value to the beginning portfolio value.
 
According to TSP, my last 12 months return is (as of Oct. 31st) 27.52%. I don't know what it is from 1/1/12 to date. Also, haven't looked in a couple of weeks, but at last glance, Vanguard said wife's rollover IRA was around 8.5% or so, roughly the same for our Roth IRA's.

edit: Vanguard says YTD on our Roth IRA's are currently 7.64%.
 
The OP asked for 'returns', which means gains/losses net of deposits/withdrawals. We can't know if some people reporting here have followed that definition, unless they specified.

Including deposits/withdrawals, the question should be "How has your net worth changed YTD?" - but that isn't a useful number if you are trying to compare investments, as the OP is.


You should be aware, there is a big difference in age between imoldernu(hint: imoldernu=I'm-Older-Than-You) and obgyn65. Many people would consider his AA to be appropriate for his age, but not for a younger person. Apples-oranges.

-ERD50


imoldernu so sensious up can you get me a beer. ha ha ha
 
As of 10/31/12 - 9.24%
As of 11/16/12 - 7.45% So how low do we go?

I like Vanguard Wellington better. It has only 33% bonds. Bonds can really hurt us next year.
 
Last edited:
In my case it is the internal rate of return on my investment portfolio given the beginning market value, cash flow (additions, withdrawals, interest, dividends, etc) and ending market value; then converted to an annualized rate. It is off the Investment Performance report in Quicken.
I always look at YTD return % of the total portfolio and compare it to S&P 500 index %. Should I annualize it? Is the S&P 500 index YTD % an annualized rate?
 
Back
Top Bottom