SWR range and distribution

wabmester

Thinks s/he gets paid by the post
Joined
Dec 6, 2003
Messages
4,459
We all know that FIREcalc gives us the worst-case SWR, but I've always wondered about the range and distribution of SWRs too.   So, I did a run trying to find the best case by asking FC to find the SWR with a 1% success rate.   Turns out that the best case for the default settings is a withdrawal rate of about 10%.

I thought that was sort of interesting, but I've got to ask:

1) What happened to the output option that let me see the results of all the runs?   At a minimum, I'd like to see the starting year of the worst-case sequence that FC found that matched my success rate criterion.

2) Asking FC to find the 1% success rate result is basically equivalent to asking it to find the best case withdrawal.    So, how about adding an option that searches for the best-case SWR and displays the range and distribution of all the SWRs it found along the way?   I think this would be more informative than displaying a single result for the 95% case, for example.   And it shouldn't be any more computationally expensive than what FC already does.
 
wab said:
We all know that FIREcalc gives us the worst-case SWR, but I've always wondered about the range and distribution of SWRs too.   So, I did a run trying to find the best case by asking FC to find the SWR with a 1% success rate.   Turns out that the best case for the default settings is a withdrawal rate of about 10%.

I thought that was sort of interesting, but I've got to ask:

1) What happened to the output option that let me see the results of all the runs?   At a minimum, I'd like to see the starting year of the worst-case sequence that FC found that matched my success rate criterion.

Look at Advanced FIRECalc, and click on the "results" tab. Select "End-of-year portfolio balances (text)" and you'll get all the detail.

2) Asking FC to find the 1% success rate result is basically equivalent to asking it to find the best case withdrawal.    So, how about adding an option that searches for the best-case SWR and displays the range and distribution of all the SWRs it found along the way?   I think this would be more informative than displaying a single result for the 95% case, for example.   And it shouldn't be any more computationally expensive than what FC already does.
One quibble -- by definition, anything other than the worst case is not SWR, it's a withdrawal rate that is less than "safe" to some degree.

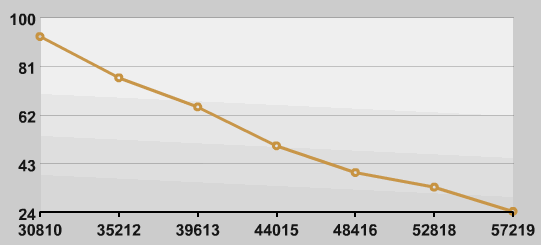
You can already see the range, although not necessarily the entire possible range. I just tried searching for a 50% success rate, and the resulting chart showed (in dollars, not percent, since that's what we wind up spending) the withdrawals resulting in success rates from nearly 100% to 24%. Graph screen-grabbed and inserted below.

Your finding about 10% being at the 1% success rate is indeed interesting, especially since, for some strange reason, a lot of people seem to think they can actually withdraw 10% and be successful.

But while it is interesting as a counter-example, I'm not quite sure what one would do with best[/u] case information in a tool designed to help decide if one had enough saved up to retire.
 

Attachments

  • 50pct.gif
    50pct.gif
    7.8 KB · Views: 62
  • 50pct.gif_thumb
    6.2 KB · Views: 2
dory36 said:
Look at Advanced FIRECalc, and click on the "results" tab. Select "End-of-year portfolio balances (text)" and you'll get all the detail.

Looks like that option is only available if I don't also ask FC to find a specific success rate.    I suppose I can do a couple of iterations to get what I'm looking for.

You can already see the range, although not necessarily the entire possible range. I just tried searching for a 50% success rate, and the resulting chart showed (in dollars, not percent, since that's what we wind up spending) the withdrawals resulting in success rates from nearly 100% to 24%. Graph screen-grabbed and inserted below.

Yup, that's very close to what I was looking for, but I wanted the entire range, and maybe the option to label the graph in terms of percentages rather than dollar amounts.

The idea would be to look for a place in the range of results for a "fall-off" in the curve.    Obviously, there's only going to be one or two at 10%, but maybe there's a significant chance of success at 6%, for example.

Like I said, I can iterate a few times to get what I'm looking for, so it's no big deal, but I thought it might be universally interesting for people to see the full range and distribution at a glance.
 
That might make a better graph - 100% to 0% -- than 70%, 80%, 90%, 110%, 120%, and 130% of the requested withdrawal. But doing so would make the narrower range less easy to read.

I have to think that someone at work, wondering about retiring next year, is most concerned about the likely success of the likely retirement portfolio and withdrawals, plus or minus a little bit, rather than a best case that would have little bearing on the decision.

I'll leave the abstract theoretical situations for grad students... :LOL:
 
Well, as you said yourself, it's interesting to know the upper end of the range.    If somebody runs FC and balks at 4%, they may think "eh, I bet 10% will be fine."    FC could easily reset those expectations by displaying the full range and probability distribution at a glance.

OK, OK, I'll publish my findings in a book.  :)

Also, I'm having a hard time reading the textual output for the year-end balances.   Oh, I see what happened.    It looks like you allocated a specific column width in the output, so for large negative results, the "-" is on one line, and the rest of the number is on the line below.

FWIW, it looks like the 10% withdrawal rate only worked if you retired in 1877.  :)
 
Dang -- I knew I should have retired in 1877!

FWIW, if there were no changes to the withdrawals or portfolio allowed, displaying the range would be trivial, but it turns out to computationally pretty costly with those built in. Because they can come in at any year, an iterative process is the only real way to get a result. And since FIRECalc itself is a bunch of loops within loops, the computational demands can get big quickly.

The process to find the withdrawal that gets a given success rate actually runs the basic iterative FIRECalc computation about 22 times. To display the full range, I'd probably have to solve for 0%, 10%,20% . . . 100%, or ballpark 250 times the load imposed by a "standard" FC run.

If you look at the tiny faint print at the bottom left of the results page, you'll see that typical standard runs take around a quarter of a second to execute when the server is very lightly loaded, and the ones that solve for a given success rate take around 4-6 seconds.

What would probably make sense is some better instructions for the person who is new to all of this...
 
Back
Top Bottom