What is the dividend yield on your portfolio

No idea; likely higher than last year - especially given the reduced valuations.
So it's interesting that the dividend yield % number can look 'better' (higher), even if it is lower in absolute terms, if the market value of the assets dropped further than the dividends.

Hypothetical Example - A $3 dividend on $100 worth of stock is 3% yield.

A year later, the dividend has dropped to $2, but the stock has dropped to $50, so the dividend yield is now 'better' at 4%. But certainly not 'better' for someone 'living off dividends'!

I'm not sure what anyone learns from a single number like this.

-ERD50
 
Last edited:
Ah, this makes me look up my situation, and again it is easy with a few mouse clicks on Quicken. I still have to compute the percentages by hand though, as Quicken only shows the $ amounts.

"Quicken, Quicken on the screen! What are my total dividends and interests between these two dates?"

Using trailing 12-month number because the 4th quarter dividends are not all in:

12/11/2021-12/11/2022 vs. 12/11/2020-12/11/2021:

Portfolio change: 0.935x
Total income change: 1.58x
Total dividend change: 1.45x
Total interest change: 2.11x

The increase in interest income is not surprising, of course. The dividend increase is more interesting. It is due to my picking up more energy stocks and other value stocks, and they pay more dividends than the overall S&P. I keep some semi equipment stocks, and they went down, cancelling out the gain of the other stocks. So, roughly a small decrease in portfolio value, but quite a bit more income. Again, the dividend increase is incidental, as I picked up the energy stocks for the fundamentals (expecting capital gains), and not for their dividends.

In short, I have gained more income in both $ amounts as well as in yields. The drop of portfolio value in dollar amount is a heck of a lot more than the income, but that's the way stock values fluctuate.

Now, I wonder what was the 12-month change before that.

12/11/2020-12/11/2021 vs. 12/11/2019-12/11/2020:

Portfolio change: 1.25x
Total income change: 1.19x
Total dividend change: 1.18x
Total interest change: 1.21x

Not much change in yield as a percentage (it dropped slightly according to the ratio of 1.19x/1.25x), but overall quite decent gains of income and capital in $ amounts and also in percentages last year. I am happy.
 
Last edited:
...
12/11/2021-12/11/2022 vs. 12/11/2020-12/11/2021:

Portfolio change: 0.935x
Total income change: 1.58x
Total dividend change: 1.45x
Total interest change: 2.11x

The increase in interest income is not surprising, of course. The dividend increase is more interesting. It is due to my picking up more energy stocks and other value stocks, and they pay more dividends than the overall S&P. ...

In short, I have gained more income in both $ amounts as well as in yields. The drop of portfolio value in dollar amount is a heck of a lot more than the income, but that's the way stock values fluctuate.

...

Similar results, different path.
My dollar amount from dividends increased about 9% between 2021 and 2022. My portfolio decreased about 20%. No energy stocks though.
This is one of the reasons I love dividends. They tend to weather fluctuations better than the stock prices. This was true for the 2008 recession as well (for me at least).
 
It would take hours for me to figure that out! I have four accounts at E*Trade, my wife has one, plus Ally Bank and a Computershare account.
 
Last edited:
I really won’t know until after the end of the year after all my distributions are paid out and the foreign tax credit is reported (which increases dividend distributions after the fact). Fortunately it doesn’t matter to me so I never try to calculate it.
 
For our accounts at Fidelity:

Average Maturity: 4.84 years
Average Estimated Yield: 7.30877%
Average Coupon Rate: 5.94226%

100% fixed income portfolio (50% high grade corporate 10% CDs, 34% High yield corporates, 6% Cash).
 
So it's interesting that the dividend yield % number can look 'better' (higher), even if it is lower in absolute terms, if the market value of the assets dropped further than the dividends.

Hypothetical Example - A $3 dividend on $100 worth of stock is 3% yield.

A year later, the dividend has dropped to $2, but the stock has dropped to $50, so the dividend yield is now 'better' at 4%. But certainly not 'better' for someone 'living off dividends'!

I'm not sure what anyone learns from a single number like this.

-ERD50
Apples/oranges. The OP asked about portfolio yield as his/her measure of SWR from the portfolio. Your example is the yield of a hypothetical individual stock that varied (cut?) its dividend by 1/3 and had its stock price cut in half.
 
Quicken makes it easy for me to pull up the number.

Last 12-month dividend+interest over current portfolio value: 2.69%.

Whoa, it's the same as the OP's number. What coincidence!

I used the trailing 12-month number, because I don't yet have the year-end value for 2022, but my number includes the year-end value of 2021...


For me, another source of income is the option premium I get from writing covered calls on the stocks I hold, and covered puts on the cash.

Again, it's easy to use Quicken to look at the sum of these option premiums over the trailing 12 months. I will just say that it's significantly more than the 2.69% above. Altogether, it helps me keep up with inflation (not quite, but it helps).

In dollar amount, I would say that my time spent writing options pays more than 2x per hour what I made when last working, and I was quite reasonably compensated as a contracted engineer.
 
Last edited:
For me, another source of income is the option premium I get from writing covered calls on the stocks I hold, and covered puts on the cash.

Again, it's easy to use Quicken to look at the sum of these option premiums over the trailing 12 months. I will just say that it's significantly more than the 2.69% above. Altogether, it helps me keep up with inflation (not quite, but it helps).

In dollar amount, I would say that my time spent writing options pays more than 2x per hour what I made when last working, and I was quite reasonably compensated as a contracted engineer.

This income is not adjusted downward for the opportunity cost less taxes of the gains you missed out on when you have stocks called away from you, right?

I'm guessing it's probably hard to say how much as I think you buy and sell stocks as well as write options.

(Signed, a passive Bogle-type who is curious but lazy)
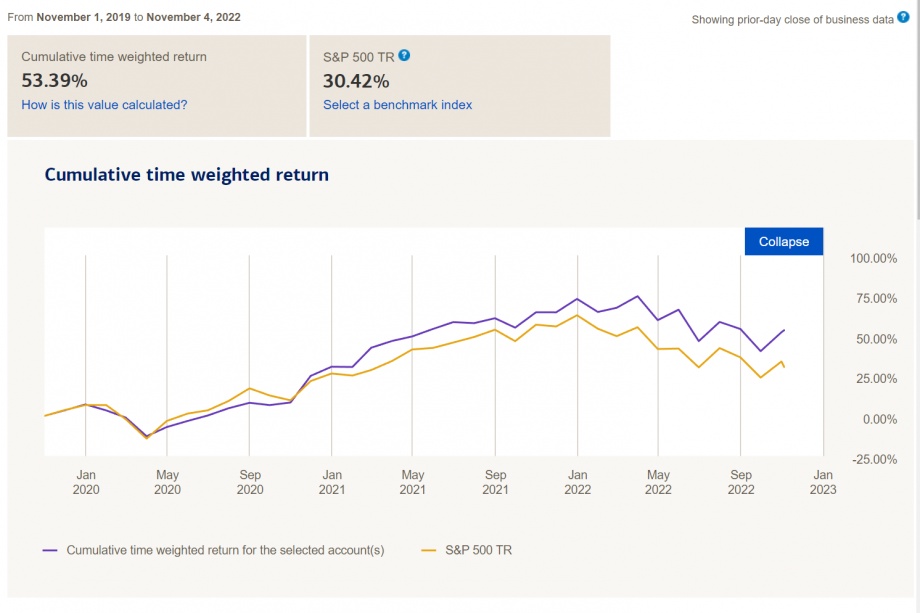

I usually try to set the price far out enough to avoid assignment. However, assignments still happen when the market goes crazy.

Quite often, when the timing is right, I would get a call assigned and was able to sell a put to buy the same stock back at the same price a week later. I got the stock back, plus premiums on the call and the put too.

I sell calls/puts with an eye to keep my AA at a desired set point.

In the end, it's all about how my total stash moves with respect to a buy/rebalance benchmark of 60/40, 70/30, or 80/20.

PS. I posted this graph a month or two ago, when someone asked a similar question. This graph is computed by a brokerage which holds about 70% of my investable assets. Total portfolio performance is less, because the other 30% includes I bonds and such.

10965-albums221-picture2732.png
 
Last edited:
Originally Posted by ERD50 View Post
So it's interesting that the dividend yield % number can look 'better' (higher), even if it is lower in absolute terms, if the market value of the assets dropped further than the dividends.

Hypothetical Example - A $3 dividend on $100 worth of stock is 3% yield.

A year later, the dividend has dropped to $2, but the stock has dropped to $50, so the dividend yield is now 'better' at 4%. But certainly not 'better' for someone 'living off dividends'!

I'm not sure what anyone learns from a single number like this.

-ERD50
Apples/oranges. The OP asked about portfolio yield as his/her measure of SWR from the portfolio. Your example is the yield of a hypothetical individual stock that varied (cut?) its dividend by 1/3 and had its stock price cut in half.

No, I think it applies.

OP mentioned the % yield, and yes, he has decided that this is his WR (safe or not is always questionable).

So that % could be higher than last year, but the amount could be lower (even across the whole portfolio). So I still don't see the point. You don't pay bills in % of your portfolio, you pay in dollar amounts.

-ERD50
 
No, I think it applies.


OP mentioned the % yield, and yes, he has decided that this is his WR (safe or not is always questionable).


So that % could be higher than last year, but the amount could be lower (even across the whole portfolio). So I still don't see the point. You don't pay bills in % of your portfolio, you pay in dollar amounts.


-ERD50


Yield on cost gives a more accurate representation of the value of a dividend investment. I may calculate to total yield on cost tomorrow. I do know my best dividend performer is Broadcom that is currently paying over 15% yield on cost.
 
If you bought an asset decades ago, is it meaningful to look at its original cost as the basis for the yield?
 
If you bought an asset decades ago, is it meaningful to look at its original cost as the basis for the yield?


Why not? It sure can indicate a great performing stock that grows its dividend.

ETA: I bought AVGO between 2013 and 2015, so it hasn’t been decades.
 
So I still don't see the point. You don't pay bills in % of your portfolio, you pay in dollar amounts.-ERD50


Living expenses don't change much - if insured or provisioned. Entertainment expenses and capital value can be highly variable.

Possible to vary entertainment expenses so that total expenses remain constant % of capital.
 
my best dividend performer is Broadcom that is currently paying over 15% yield on cost.

Whereas dividend return is 3.22% on market value of $USA571

ASX: FMG 14.66% gross, market $A20.24

Dividends divided by Cost or Market?

I say market because comparing other possible investments on based value at one or more times in the past is not as useful as comparing based on value now.
 
Last edited:
Why not? It sure can indicate a great performing stock that grows its dividend.

ETA: I bought AVGO between 2013 and 2015, so it hasn’t been decades.


The problem is that over a long period, the early performance may mask out the recent performance of the asset.

The earlier growth phase may be exceptional, but if the asset's recent performance is trailing the market one may investigate the cause. Perhaps it is time to sell it and replace with something else.


PS. I cross-posted with Samsung, who had the same idea.


Only if you have tunnel vision. Why would focus on only one metric. Dividend growth as well as price appreciation, earnings growth, margins can all be monitored together.
If you buy a 10, 20 or 30 year bond for $10,000 that pays 6%, you’re probably thinking you’re getting a good deal. If you invest $10,000 in a stock that grows in price at an average 5% per year and pays a 2% dividend that grows average 7% a year, which do you think would do better over 10, 20 or 30 years?
 
Yield on cost gives a more accurate representation of the value of a dividend investment. I may calculate to total yield on cost tomorrow. I do know my best dividend performer is Broadcom that is currently paying over 15% yield on cost.

Don't bother on my account. :)

This was discussed here a while back. Yield on cost is a meaningless metric. The only way where I could see that it had any relevance was if someone had an asset that couldn't be sold. Then, I suppose you could compare with other people with assets that can't be sold. I can't picture this scenario.

The point to that is, as long as you can sell it, you can move to something better ('better' being higher dividend in this case). The only thing that will tell you if something is better or not, is to compare yield on current value. Yield on cost tells you nothing of value.

Hypo Example:

I buy a stock that pays a steady $1 in divs, and I paid $10 for the stock years ago, 10% YOC.

You buy that same stock today at $20. You have a YOC of 5%. But it's the same stock with the same outlook. A metric that gives a 2x difference for the exact same thing is meaningless.

Same thing if those were 2 different stocks that you owned. YOC would tell you nothing.

-ERD50
 

Latest posts

Back
Top Bottom