2017 YTD investment performance thread

In 2016 mid February, the YTD did not look good; I think I was -7% at that time. But the full year turned out to be great.

In 2017 mid February, the YTD looks great. But ...
 
Sitting around 2.8% as of 2/13 for a 62% stock/ 38% bond+short term aggregate of all of my accounts. YTD across accounts range from 1.9% to 3.2%.
 
In 2016 mid February, the YTD did not look good; I think I was -7% at that time. But the full year turned out to be great.

In 2017 mid February, the YTD looks great. But ...

Yeah, I know. I keep trying to remind myself of that! Both of my brokerage accounts are up 3.5%; I'm 73% in equities, which is pretty aggressive. The Vanguard Wellington in my HSA is knocking it out of the ballpark. Too bad that's only $22K.

DH had made his son the beneficiary of a small ($18K) IRA but after DH's leukemia diagnosis we spoke to DSS and it turned out that what DSS intended to do was liquidate it immediately and pay whatever taxes were due.:nonono: We changed the beneficiary to me and I gave DSS a check for what the account was worth the day DH died. It's gone up by over $800 since that day.
 
I write the numbers on a piece of paper with a pen at the start of the year and then I look at the statements and compare to what I wrote on the paper for the rest of the year.
Basically what I do, but with bits and bytes instead of paper and ink.

However, one still has to account for deposits, or in our case withdrawals, to know the true growth or shrinkage due to investments.
 
Up 4.3% on my tIRA, and down .01% in our taxable and Roth (Taxable was a drain, QCOM was a big hit, accounting for most of the loss, and VZ was the remainder, ROTH is up 2.3%). This leaves a net up of 2.4%.
 
4.3% YTD as of close of market on 2/15/2017, compared to 4.9% of the S&P.

And that is computed over every account, including cash in checking account, Roth, IRA, 401k, etc...

Yet, stock AA is only 64% (and climbing). The bubble is inflating. :) Easy, easy now... Stretch, then stretch some more...
 
Last edited:
I'm so kicking myself for sitting on 75% cash since Nov 16...it's what I get for timing the market. I really thought by Feb the market would take a nose dive.
 
2.9% versus S&P at 4.91% , again with the bonds nearly 39% and with mostly corporate debt average duration of 6.6 years. I believe this will continue to be a drag on performance offering much more risk than in the past 10 years. I am considering moving my bond fund allocation to shorter term debt, which will require liquidating a lot of VWIAX and VWENX. This will require some careful rebalance and today seems to be a good day to do so. Any suggestions for managed bond funds others are using would be appreciated.
 
5.3% YTD. Again, that's computed over every account, including all cash, even including even the checking account.

That's pretty darn good, so it makes me a bit worried that it may not last. So, I looked back at my diary and computed the gains in past years in the same first 51 days of the year.

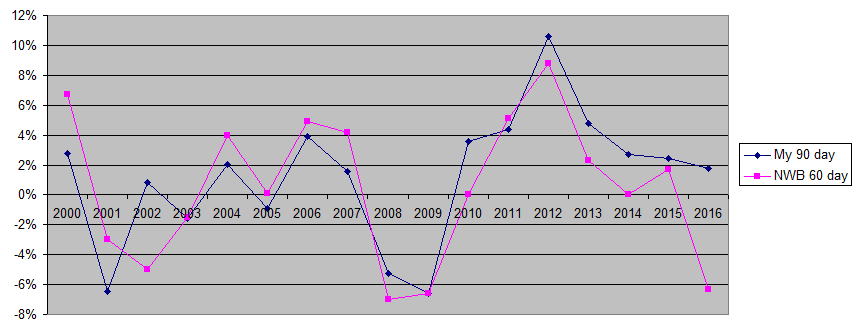
Here are some more numbers from my diary, showing the gains from Jan 1 to Feb 21 of the past years.

2000: 6.7%
2001: -3.0%
2002: -5.0%
2003: -1.5%
2004: 4.0%
2005: 0.1%
2006: 4.9%
2007: 4.2%
2008: -7.0%
2009: -6.6%
2010: 0.0%
2011: 5.1%
2012: 8.8%
2013: 2.3%
2014: 0.0%
2015: 1.7%
2016: -6.3%
2017: 5.3%

In that crazy year of 2000, I had a gain of 6.7%. That year did not end well.

But look at 2012. I forgot I had one heck of an early gain that year. But it soon plateaued out. I ended up the year 2012 with 10.8% gain, a mere 2% increase from that early gain.

So, what do I get from this? Not much other than anything can happen after the first couple of months of the year. I am going to hold or just continue to write more out-of-the-money covered calls until something develops that makes me want to sell.
 
As of today, I'm up 4.8% for YTD.

I just spent the last half hour modifying my spreadsheet so I can do XIRR runs for more accurate info, so it's going to be exciting to see how this goes for the rest of the year.
 
These YTD threads are making me look too much :facepalm:

Anywho, rounded:

  • Index +3%
  • Individual +4%, includes (too much) cash from sales doing nothing. Need new stock ideas.
  • Emerging market tracker: +11%
I had a -10% in my (budget) forecast for this year, guess I'll have to make that -15% for 2018 ..
 
I really have no idea since I sold all existing positions in late January, transferred funds to a new broker and then fired up a completely different, much-less-diverse portfolio. That new portfolio is up over 5% since Feb. 3. Rising tide, and all. I have no complaints :)
 
Since Jan 1 2017 4.27% 80% stock 20% bonds in markets and 4 years of expenses in cash. If we hit 7% will add another year of expenses to cash bucket. My WD strategy is based on market add when high and use big cash bucket in times market is down.
 
Equity side has drifted up a bit. Will wait for March 2017 to rebalance, if necessary.
This year I'll report the weighted performance of all investments, including cash. YTD performance value is pulled from google finance, and spreadsheet assigns weighted performance to each fund/stock.

YTD Wghtd for Equity/Fixed/Cash (55/40/5)
1.199%

A bit early for end of Feb 2017. Will have to do:

YTD Wghtd Perf - 3.57%

Port Total YTD - 8.13%
 
At the end of Feb, I am up 3%. My International, Tech & Chemical funds did well. Others trailed the S&P 500. Overall, my portfolio of 60/40 couldn't keep up with the market.

My short term trades also underperformed the market, returning about 2.5%. It is largely due to my retirement life becoming busier (since I took up learning the game of Go - a topic for another thread, perhaps). When I found time to trade, I was reluctant to "buy" when market keeps hitting all time high. When I don't buy, I can't make money. Still, it's on track for about 12 - 15% gain for the year. In the past two years, I've averaged 15% gain per year.
 
I'm very happy with 3.6%. AA is reaching my upper band limit so if this rise continues I'll adjust at end of 1st quarter.
 
3.75% YTD through 2/28/2017... a good start for the year, but only 2 months so it would be a little premature to get too excited.
 
5.3% YTD. Again, that's computed over every account, including all cash, even including even the checking account.
I'm at 4.7%, same methodology, but I do add-back spending, so 1/6 annual expenses.

So, what do I get from this?
I was going to say "wow, I don't have that detail", but I do have something similar.

I was doing quarterly measurements from brokerage statements for 35 years. Nowadays I have a screen scraper app that logs on to nine sites and grabs the current position. I wish there were fewer sites, but IRAs, 401k, 401k brokerage, HSA, HSA brokerage, treasury direct, banks...well, you get the picture.

Anyway, I took minus the year-end balance in one cell and an adjusted March 31st balance in another cell, then did an IRR on it and divided by 4. The adjustment is to correct for additions or subtractions in the quarter.
 

Attachments

  • FirstQuarterReturns.PNG
    FirstQuarterReturns.PNG
    14.5 KB · Views: 28
So, I finished the first 2 months of 2017 with a gain of 5%. Not shabby for holding a big wad of cash.

A clarification: I do add back the cash that I converted to food, utilities, etc... The expenses YTD run at 2.3% annualized! Holy moly, it has never been this low. Something may change at any minute now, like my roof developing a leak, or the AC croaking, or something. Just cannot take anything for granted as it is against my pessimistic nature.
 
Back
Top Bottom