- Joined
- Oct 13, 2010
- Messages
- 10,740
My calculation is very simple. It has three values: 1) current balance of all accounts (including cash, HSA, everything except the change in the couch), 2) that same total from January 1, and 3) the estimated spending YTD.
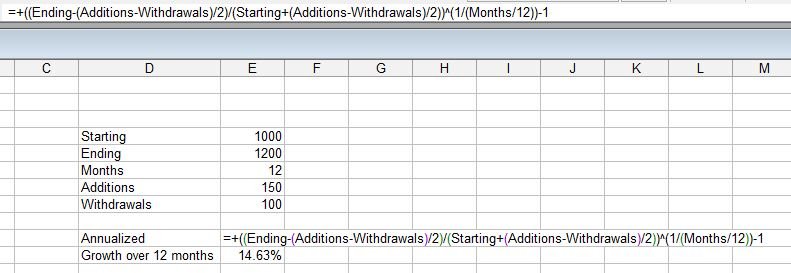
We've been calling it "money chimp" style spending adjustment if you do it this way:
=(CurrentAllInBalance+YtdSpend/2)/(StartYearBalance-YtdSpend/2)-1
There was a bit of analysis done by the smart people here that suggested the above estimate matched the gold standard of XIRR pretty closely.
I feel there are a lot of reports on this thread that do it differently, that's fine. There's probably some cherry picking, that's fine. There's probably outright fiction, that's fine. It's all about entertainment.
")