2019 YTD Investment Performance Thread

1/31 +10% YTD Over half recovered from my terrible Nov/Dec '18
2/28 +14.57% and almost back to my 52 week high.just another ~4.5% to break the 52 week high
3/31 +16.75% and I was beating all three major indexes...
4/30 +21% 52week high, net worth at record highs, liabilities at all time lows...blessed.
5/31 +13.27% nice little 7% tariff haircut. Oh, I know it was priced in eh?
6/28 +21.46% regaining my 52 week high from back in April I'll take an 8% month :D. Much more action than we've seen in June for a while


97% Equities / 3% Cash
 
11.34% YTD through tonight.... VSMGX still ahead at 12.26% and stretching its lead from 0.71% through the end of May to 0.92% through the end of June. :(

6.83% YTD through the end of May. VSMGX had a better month... is now 7.54% YTD.
 
In my trading account:
Jan +2300
Feb +200
Mar -200
April -3000k. Darn futures, I went from proven technique to crap!!! I was trying to trade tick charts or 5 min charts.
May: I switched brokers. I’ve decided on trade-station, as I like their fees the best.
May 15 - today: 4300. Utilizing my original technique


2018: minimal trading: good 1st half: bought Disney Cruise, supporting parent all year and rental house had me way to spread out during the second half of the year.

2017: I forget exact amount, but, a lot! Bought 2 new cars in cash, Disney vacation. Mainly thanks to Spwr and FSLR.
 
Here's my results, so far this year...
1/31/19: +7.94%
2/28/19: +11.4%
3/31/19: +12.8%
4/30/19: +15.6%
5/31/19: +10.4%
6/28/19: +15.8%

And, as before, that's rate of return, rather than just how much my net worth has accumulated, since that would be thrown off by additional investments.
 
After 6, I'm in at 11.75% YTD.
 
Last edited:
May 2019

  • +10.22% Total Portfolio Value increase YTD (End of May)
  • +06.84% YTD Performance (End of May), total pie weighted
  • 50-45-05 (Stk-Bnd-Csh) Target AA
Not ready to give up the ship, although I was overboard for May, but managed to climb back in...

My 401k contributions were reduced for the month, due to non-work. Long story! Not enough to get worried about.

If I'm Stocks, and she's Bonds, Bonds worked for us throughout the month.
:D

Have a superb June.
June 2019

  • +14.21% Total Portfolio Value increase YTD (End of June)
  • +10.36% YTD Performance (End of June), total pie weighted
  • 50-45-05 (Stk-Bnd-Csh) Target AA
June was a fantastic month for investing and saving. FYI, off-screen we have two salaries (mine reduced 40% this year), and our monthly spend comes out of that. So it really is a rosy picture.

RLBGX American Funds Balanced R6 is +11.09% YTD according to M*. I hold that 50/50 fund in one of my 401k accounts, and it looks like a good barometer (or proxy) for overall performance of our AA.
:clap:
 
Change in net worth:
YTD: +12.2%
June30,2018-June 28, 2019: +2.8%
Peak in NW was Jan 2018. Down 3% since then. Large exposure to a single stock helped reach the peak, but led the way down as well. I'm out of that position now.
AA approx 76/21/3 today.
 
Thanks. I thought that is it but just wanted to make sure.
Just looked and my 1-Yr is 5.4% this is the average from 3 different investment firms.
 
YTD (June 28, 2019) returns for a collection of 'close-to' 60/40 funds (from Morningstar.com and Vanguard.com):

12.26% VSMGX Vg LifeStrategy Moderate Growth (60/40)
13.66% VBIAX Vg Balanced Index (60/40), no foreign
11.37% DGSIX DFA Global 60/40 I, small-cap & value tilted
12.46% VTTVX Vg Target Retirement 2025 (62/38)

11.28% VTWNX Vg Target Retirement 2020 (53/47)*
12.91% VWENX Vg Wellington (67/33)*

Some others
01.18% VMMXX Vg Prime Money Market
06.11% VBTLX Vg Total US Bond Index
04.70% VSCSX Vg Short-term corporate bond index
18.81% VTSAX Vg Total US Stock Market
13.27% VTIAX Vg Total Int'l Stock Market
19.31% VGSLX Vg REIT Index
15.63% VSIAX Vg Small Cap Value Index
19.28% MTUM IShares USA Momentum Factor ETF

*These 2 funds VTWNX and VWENX are outliers because they are not that close to a 60/40 asset allocation this year.

The June 30 numbers should be the same as the June 28 numbers because it's a weekend.
 
Last edited:
YTD performance through Q2: 15.70% vs benchmark VTHRX (Vanguard Target Retirement 2030) 13.27%.

Allocation follows VTHRX (currently 68/32).

Top-performer YTD: Vanguard US Growth (VWUAX)

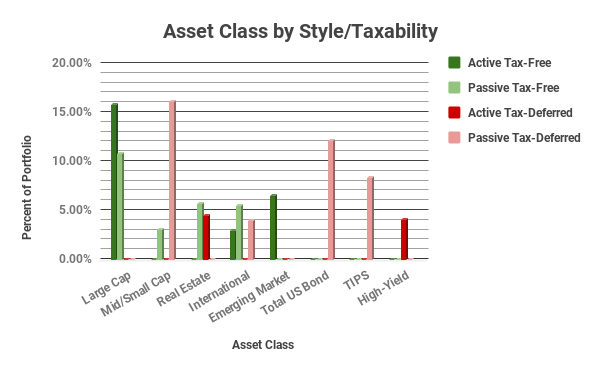
I've added a handful of charts to my Sheets workbook to help get views that I can't (or don't know how to) coerce from Quicken. One shows the breakdown of my portfolio with respect to investment style (passive/active) and tax treatment (tax-deferred vs. tax-free/Roth). Overall, it's ~66/34 (passive/active) and ~50/50 (traditional/Roth).
 

Attachments

  • Asset Class by Style_Taxability.png
    Asset Class by Style_Taxability.png
    20.2 KB · Views: 32
Dunno if I should post my YTD return.

The last time I did it for April 30, it prompted the following exchange.

You double digit folks are nailing it. Lol I hope it continues.

I thought I nailed it in Jan 2018.

Unfortunately, my nail did not have holding power, and it came loose in Dec 2018.


In April, I had a wonderful gain from my semiconductor stocks, and did not think that would last, so wrote many out-of-the-money covered calls on them. The price went way past what I thought was already a high price, and I had to sell many shares below the market price in late April.

If I just sat in cash as I originally intended to do to reduce my stock AA, I would keep my gain. Instead, I got greedy and sold a bunch of May put options to buy them back at the price I sold. I was in Europe, and had Internet access, so thought I would do a few trades. Even if the stocks dropped, I still got cash from both the call and put options, and was still ahead compared to doing nothing and just holding the shares. Right?

When the honcho guy lowered the axe on Huawei, the effect was an H-bomb being dropped on the semi sector. ARGHHH! Major pain! I remained firmly on the positive ground and still made good money YTD, but look at what I lost. A few hundred $K gone, just like that.

I did not sell, but would not want to buy more. I already had too much exposure to this sector as it was. I hang on, and the shares are now recovering, but need to go a bit more to get back to where I was at the end of April.

I started to write some covered call options again, but this time if they get exercised I will sit in cash. And indeed some June options got exercised, and my stock AA is now 66% instead of 70+% as at the end of April. I left some money on the table, but still remember the lesson learned just last month.

So, I shall restraint from bragging about YTD return here. It will offend the market god, considering also all the "Wh***" that were proclaimed here.

Looking to writing more out-of-the-money covered calls in the days ahead, and reducing stock AA further.

PS. The gain I have had so far this year is really nothing to brag about, considering that 2018 was a bad year for me.

PPS. It's not just stock AA exposure, but exposure to the more volatile sectors that drives the portfolio to exceed or trail the market. Not for the faint of heart.
 
Last edited:
... as of last night, I have a 14.93% return YTD. And, if I can get about another 0.5%, I'll be back to where I was at the end of September 2018, and, in my mind at least, "made whole" again.

And if this doesn't hold, maybe instead of nailing it, I'll have to screw it! :D

Forgot to say, it does not matter whether you use nail or screw if it only penetrates the drywall without hitting any stud. :p
 
YTD rate of return (excluding new contributions) 12.9 %
Portfolio: 65/35
 
Back
Top Bottom