I believe the funds are restricted to owning 10% or less of an issue. This restricts the size and NAV of the fund and, consequently, the number of investors in the fund. To the point where the fund is not viable as a mass-market offering.
So they could still construct a fund from as few as 11 stocks. There is a DOW 30 fund. Your chart shows ~ 14 holdings - shouldn't be a problem, even if they had to 'water it down' a bit with some lower div payers, or bonds (you could adjust your AA in other areas)?
... First, the goal is for the portfolio to provide reliable income regardless of portfolio value. ....
And part of what some us are trying to get across, is that this an objectively silly and unhelpful way to view an investment.
If that is your stated goal, then an investor looking in hindsight at an investment choice of:
A) One that kicks off 10% divs a year, and is down 50% in market value at the end of 10 years , and
B) One that has only 2% divs, but after selling ~ 8% each year for 10 years to provide the same cash flow, has a market value that is up 50%.
would chose "A". Yes, that's an extreme hypothetical, but it fits your "goal", so clearly that goal is not helpful.
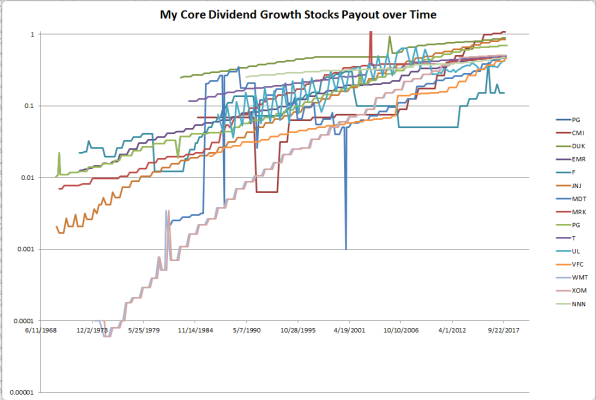
.... The image below shows the dividend payouts for all time for the core DGI stocks in my portfolio. There are many other stocks like this which I don't happen to own right now.
These are special stocks BECAUSE they maintain their dividends and many more may be found at David Fish's excellent site:
The DRiP Investing Resource Center - DRiP Information, Tools, And Forms
...
These stocks pay between 2% and 5% now, although my yield on cost (YOC) is much higher, because I bought them carefully.
YOC is another non-useful measurement. Money is fungible. The current value could be moved to another investment. The future outlook of a stock is not changed because one person bought it @ $10, and another bought it @ $50.
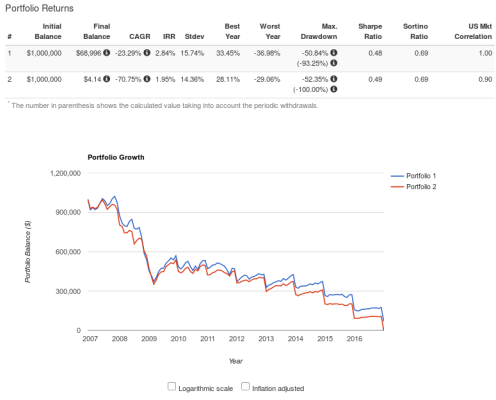
So I plugged that stock list into the portfolio analyzer (yes, I'm a sick puppy!
")
), and the results were very impressive.
But that leads me to two questions:
Were these stocks picked in 2001 (as far back as the analysis went), or are they current picks based on current results (survivor bias)?
If they were 2001 picks, then I have to ask again, if this is something that can be defined by an algorithm, then why don't we see mutual funds ETFs with this kind of performance (even watered down would be fine)? And if it can't be condensed to a reliable, repeatable algorithm, it is a moot point for others. IOW, is there any public, forward looking data based on a high-dividend 'system' that shows performance of picks made years ago?
https://www.portfoliovisualizer.com...llocation23_3=8&symbol24=NNN&allocation24_3=8
-ERD50