Dividend paying stocks

Well when I look at the VIG and VTI for the period 12-27-2007 through 12-30-2010, I see that VTI lost about 53% start to market trough 3-6-2009, and VIG lost 44%.

If you follow through the end of the periods selected, VIG had higher total return, losing about 1% versus loss of 6.5% for VTI. (I double-checked these using Morningstar).

So maybe your point is these differences are not meaningful?

That looks about right. But we need to add some context. I selected the first 5 high-div funds I could find with histories that go back a ways. I didn't want to 'cherry pick' any one fund (like VIG). And at that trough, it looks like 3 of the 5 high-div funds dipped below VTI. And at the end, 3 of 5 were below VTI.

So yes, I don't think these differences are very meaningful, and it would depend which high-div fund you picked. If you averaged the 5, it wouldn't look much different from VTI. Ahh, I see I did that with the portfolio tool in post #49 - VTI looks marginally better, but those might very well swap positions over the next 10 years, I think we are talking noise level here, not fundamental differences. And I'm sure that I could find some other sector funds that did better than any of these. But that doesn't tell us much in general.

-ERD50
 
This was an interesting topic, and I learned a good bit from the back and forth.

ERD50, is your portfolio (positions, not specific $ amounts) posted somewhere? I'd be curious as to where you are invested since you have obviously given this significant thought.
 
This was an interesting topic, and I learned a good bit from the back and forth.

ERD50, is your portfolio (positions, not specific $ amounts) posted somewhere? I'd be curious as to where you are invested since you have obviously given this significant thought.

I give it less and less thought as time goes on. That's kind of my point. The market does what it will, sectors picks will rise and fall. No one knows. I don't see any point in over-thinking it. But I do kind of enjoy the discussions, you never know when something might trigger a thought to act on.

Off the top of my head (and I'll check in a minute to see how close my estimates are), I'm about 75/25 ~ 70/30 AA. A portion of the 75 is INTL, a European index fund and some in a SE Asia index fund, maybe 10% overall? Again, no big thought process on this, those are some individual IRAs, and that were the funds I chose years ago. So the percentage just 'happened', no big plan. Will probably review that when I do some consolidation in a few years after I'm done with ROTH conversions.

I'd put all my equities in VTI or other broad index if I was staring from scratch, but since I had used SPY for that for a while, I've broadened that with an index ETF with more small cap exposure. And some other variations are due to taxes, not investment per say. I hold some BRK and small cap index in my taxable account, because I don't want divs, in order to provide headroom for 0% LTCG harvesting, and/or ROTH conversions. A couple small holdings leftover from some previous ideas that I don't think are worth the minuscule effort to sell. For my ~ 25% fixed income, it's BND.

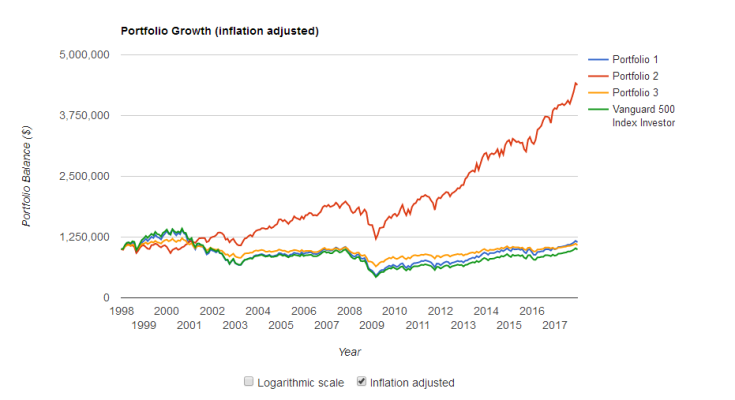
And I don't get hung up any rebalancing rules. It helps sometimes and hurts others, so I just stay lazy and do nothing, figuring that will average out. If you look at the success versus AA in FIRECalc, it's pretty similar results on anything from ~ 50/50 to 90/10. Ity's just not that sensitive, so I don't let it drive me. It's a real yawn. But looking at the 'Beat Boho" contest, you'll see that 'napper' nunnun is doing very well with the buy, hold and forget it approach.

OK, spreadsheet was updated end of OCT2017 - I was pretty close right in the middle of those ranges, with ~ 11% INTL, about 1% in cash, just for cash flow purposes.

Are you still awake?

More concisely, and probably more importantly- if someone was looking for a plan, I'd say to consider to just do whatever AA from 50/50 to 90/10 you decide on, and just go VTI/BND and call it a day. Throw in 10% INTL if you really want, throw in 5% REIT if you really want. Then forget about it. Let's go have a beer.

All the other tweaking might help, might hurt, who knows so why bother?

-ERD50
 
Hopefully the PV link below works, but in case it doesn't, I added an image which tells the tale. I compared a portfolio of 100 Dividend King stocks to VITSX (vgd Total Stk Mkt Index) and to a 60/40 bond portfolio. The Dividend King portfolio was created by simply picking 100 stocks from the DRIP website below. The selected stocks were found using one and only one qualifier: they have paid dividends every year for more than 25 years. There are 106 of them now, so I left a few out and included 1% of each of the 100. The analysis begins in 1997, since VITSX began that year. As the image and analysis shows, you would have almost 4x the money now if you invested in the 100 DK portfolio 20 years ago.

I realize ERD50 is seeking some sort of crystal ball which would make the portfolio selection brainless, but this is as close as I can get it. Just pick 100 of the 106 companies with 25 year minimum dividend payment history, invest 1% in each of them and get wealthy.

Admittedly, this portfolio does suffer from survivorship bias, since you may have picked some companies 20 years ago which are no longer viable or on the list. With each company having only 1% weight in the portfolio, I would accept those odds.

As to why an ETF or mutual fund doesn't replicate this performance I cannot really say.

The DRiP Investing Resource Center - DRiP Information, Tools, And Forms


https://www.portfoliovisualizer.com/backtest-portfolio?s=y&timePeriod=4&startYear=1985&firstMonth=1&endYear=2017&lastMonth=12&endDate=01%2F20%2F2018&initialAmount=1000000&annualOperation=2&annualAdjustment=40000&inflationAdjusted=true&annualPercentage=0.0&frequency=4&rebalanceType=1&showYield=false&reinvestDividends=true&benchmark=VFINX&symbol1=VITSX&allocation1_1=100&symbol2=BEN&allocation2_2=1&symbol3=GPC&allocation3_2=1&symbol4=HRL&allocation4_2=1&symbol5=JNJ&allocation5_2=1&symbol6=TROW&allocation6_2=1&symbol7=TGT&allocation7_2=1&symbol8=WBA&allocation8_2=1&symbol9=SRCE&allocation9_2=1&symbol10=MMM&allocation10_2=1&symbol11=ABM&allocation11_2=1&symbol12=AFL&allocation12_2=1&symbol13=APD&allocation13_2=1&symbol14=MO&allocation14_2=1&symbol15=AWR&allocation15_2=1&symbol16=WTR&allocation16_2=1&symbol17=ADM&allocation17_2=1&symbol18=T&allocation18_2=1&symbol19=ATO&allocation19_2=1&symbol20=ADP&allocation20_2=1&symbol21=BMI&allocation21_2=1&symbol22=BDX&allocation22_2=1&symbol23=BMS&allocation23_2=1&symbol24=BKH&allocation24_2=1&symbol25=BRC&allocation25_2=1&symbol26=BF-B&allocation26_2=1&symbol27=CWT&allocation27_2=1&symbol29=CSL&allocation29_2=1&symbol30=CVX&allocation30_2=1&symbol31=CINF&allocation31_2=1&symbol32=CTAS&allocation32_2=1&symbol33=CLX&allocation33_2=1&symbol34=KO&allocation34_2=1&symbol35=CL&allocation35_2=1&symbol36=CBSH&allocation36_2=1&symbol37=CBU&allocation37_2=1&symbol38=CTBI&allocation38_2=1&symbol39=CTWS&allocation39_2=1&symbol40=ED&allocation40_2=1&symbol41=DCI&allocation41_2=1&symbol42=DOV&allocation42_2=1&symbol43=EV&allocation43_2=1&symbol44=ECL&allocation44_2=1&symbol45=EMR&allocation45_2=1&symbol46=ERIE&allocation46_2=1&symbol47=XOM&allocation47_2=1&symbol48=FRT&allocation48_2=1&symbol49=THFF&allocation49_2=1&symbol50=FELE&allocation50_2=1&symbol51=GD&allocation51_2=1&symbol52=GRC&allocation52_2=1&symbol53=FUL&allocation53_2=1&symbol54=HP&allocation54_2=1&symbol55=ITW&allocation55_2=1&symbol56=JKHY&allocation56_2=1&symbol57=KMB&allocation57_2=1&symbol58=LANC&allocation58_2=1&symbol59=LEG&allocation59_2=1&symbol60=LOW&allocation60_2=1&symbol61=MKC&allocation61_2=1&symbol62=MCD&allocation62_2=1&symbol63=MGRC&allocation63_2=1&symbol64=MDU&allocation64_2=1&symbol65=MDT&allocation65_2=1&symbol66=MCY&allocation66_2=1&symbol67=MGEE&allocation67_2=1&symbol68=MSEX&allocation68_2=1&symbol69=MSA&allocation69_2=1&symbol70=NC&allocation70_2=1&symbol71=NFG&allocation71_2=1&symbol72=NNN&allocation72_2=1&symbol73=NDSN&allocation73_2=1&symbol74=NWN&allocation74_2=1&symbol75=NUE&allocation75_2=1&symbol76=ORI&allocation76_2=1&symbol77=PH&allocation77_2=1&symbol78=PNR&allocation78_2=1&symbol79=PBCT&allocation79_2=1&symbol80=PEP&allocation80_2=1&symbol81=PPG&allocation81_2=1&symbol82=PG&allocation82_2=1&symbol83=O&allocation83_2=1&symbol84=RLI&allocation84_2=1&symbol85=ROP&allocation85_2=1&symbol86=RPM&allocation86_2=1&symbol87=SPGI&allocation87_2=1&symbol88=SEIC&allocation88_2=1&symbol89=SHW&allocation89_2=1&symbol90=SJW&allocation90_2=1&symbol91=SON&allocation91_2=1&symbol92=SWK&allocation92_2=1&symbol93=SCL&allocation93_2=1&symbol94=SYK&allocation94_2=1&symbol95=SYY&allocation95_2=1&symbol96=TDS&allocation96_2=1&symbol97=TNC&allocation97_2=1&symbol98=TMP&symbol99=TR&symbol100=UGI&symbol101=UMBF&symbol102=UBSI&allocation102_2=1&symbol103=UVV&allocation103_2=1&symbol104=UHT&symbol105=VVC&symbol106=VFC&allocation106_2=1&symbol107=GWW&allocation107_2=1&symbol108=WMT&allocation108_2=1&symbol109=VTSMX&allocation109_3=60&symbol110=VBMFX&allocation110_3=40
 

Attachments

  • 100 Dividend Kings comparison to total stk mkt.png
    100 Dividend Kings comparison to total stk mkt.png
    30.8 KB · Views: 44
Last edited:
I got the analysis to go back to April 1992 by removing index funds (which don't pre-date 1997 apparently) and selecting companies amongst the 106 with longer histories.

DGI still provides 3x more $$ than the benchmark.

https://www.portfoliovisualizer.com/backtest-portfolio?s=y&timePeriod=4&startYear=1985&firstMonth=1&endYear=2017&lastMonth=12&endDate=01%2F20%2F2018&initialAmount=1000000&annualOperation=2&annualAdjustment=40000&inflationAdjusted=true&annualPercentage=0.0&frequency=4&rebalanceType=1&showYield=false&reinvestDividends=true&benchmark=VFINX&symbol1=VITSX&symbol2=BEN&allocation2_2=1&symbol3=GPC&allocation3_2=1&symbol4=HRL&allocation4_2=1&symbol5=JNJ&allocation5_2=1&symbol6=TROW&allocation6_2=1&symbol7=TGT&allocation7_2=1&symbol8=WBA&allocation8_2=1&symbol9=SRCE&symbol10=MMM&allocation10_2=1&symbol11=ABM&allocation11_2=1&symbol12=AFL&allocation12_2=1&symbol13=APD&allocation13_2=1&symbol14=MO&allocation14_2=1&symbol15=AWR&allocation15_2=1&symbol16=WTR&allocation16_2=1&symbol17=ADM&allocation17_2=1&symbol18=T&allocation18_2=1&symbol19=ATO&allocation19_2=1&symbol20=ADP&allocation20_2=1&symbol21=BMI&allocation21_2=1&symbol22=BDX&allocation22_2=1&symbol23=BMS&allocation23_2=1&symbol24=BKH&allocation24_2=1&symbol25=BRC&allocation25_2=1&symbol26=BF-B&allocation26_2=1&symbol27=CWT&allocation27_2=1&symbol29=CSL&allocation29_2=1&symbol30=CVX&allocation30_2=1&symbol31=CINF&allocation31_2=1&symbol32=CTAS&allocation32_2=1&symbol33=CLX&allocation33_2=1&symbol34=KO&allocation34_2=1&symbol35=CL&allocation35_2=1&symbol36=CBSH&allocation36_2=1&symbol37=CBU&allocation37_2=1&symbol38=CTBI&symbol39=CTWS&allocation39_2=1&symbol40=ED&allocation40_2=1&symbol41=DCI&allocation41_2=1&symbol42=DOV&allocation42_2=1&symbol43=EV&allocation43_2=1&symbol44=ECL&allocation44_2=1&symbol45=EMR&allocation45_2=1&symbol46=ERIE&symbol47=XOM&allocation47_2=1&symbol48=FRT&allocation48_2=1&symbol49=THFF&symbol50=FELE&allocation50_2=1&symbol51=GD&allocation51_2=1&symbol52=GRC&symbol53=FUL&allocation53_2=1&symbol54=HP&allocation54_2=1&symbol55=ITW&allocation55_2=1&symbol56=JKHY&allocation56_2=1&symbol57=KMB&allocation57_2=1&symbol58=LANC&allocation58_2=1&symbol59=LEG&allocation59_2=1&symbol60=LOW&allocation60_2=1&symbol61=MKC&allocation61_2=1&symbol62=MCD&allocation62_2=1&symbol63=MGRC&allocation63_2=1&symbol64=MDU&allocation64_2=1&symbol65=MDT&allocation65_2=1&symbol66=MCY&allocation66_2=1&symbol67=MGEE&allocation67_2=1&symbol68=MSEX&allocation68_2=1&symbol69=MSA&allocation69_2=1&symbol70=NC&allocation70_2=1&symbol71=NFG&allocation71_2=1&symbol72=NNN&allocation72_2=1&symbol73=NDSN&allocation73_2=1&symbol74=NWN&allocation74_2=1&symbol75=NUE&allocation75_2=1&symbol76=ORI&allocation76_2=1&symbol77=PH&allocation77_2=1&symbol78=PNR&allocation78_2=1&symbol79=PBCT&allocation79_2=1&symbol80=PEP&allocation80_2=1&symbol81=PPG&allocation81_2=1&symbol82=PG&allocation82_2=1&symbol83=O&symbol84=RLI&allocation84_2=1&symbol85=ROP&allocation85_2=1&symbol86=RPM&allocation86_2=1&symbol87=SPGI&allocation87_2=1&symbol88=SEIC&allocation88_2=1&symbol89=SHW&allocation89_2=1&symbol90=SJW&allocation90_2=1&symbol91=SON&allocation91_2=1&symbol92=SWK&allocation92_2=1&symbol93=SCL&allocation93_2=1&symbol94=SYK&allocation94_2=1&symbol95=SYY&allocation95_2=1&symbol96=TDS&allocation96_2=1&symbol97=TNC&allocation97_2=1&symbol98=TMP&allocation98_2=1&symbol99=TR&allocation99_2=1&symbol100=UGI&allocation100_2=1&symbol101=UMBF&allocation101_2=1&symbol102=UBSI&allocation102_2=1&symbol103=UVV&allocation103_2=1&symbol104=UHT&allocation104_2=1&symbol105=VVC&allocation105_2=1&symbol106=VFC&allocation106_2=1&symbol107=GWW&allocation107_2=1&symbol108=WMT&allocation108_2=1&symbol109=VTSMX&symbol110=VBMFX
 
Last edited:
More concisely, and probably more importantly- if someone was looking for a plan, I'd say to consider to just do whatever AA from 50/50 to 90/10 you decide on, and just go VTI/BND and call it a day. Throw in 10% INTL if you really want, throw in 5% REIT if you really want. Then forget about it. Let's go have a beer.
-ERD50

Excellent advice. Thank you!
 
It is an interesting discussion. I think one of the problems with something like VTI is it had really not been put there that long to see how it fares in down cycles compared to alternatives. I think something like VIG or NOBL are reducing risk while capturing most of the market upside. In my equity portfolio I am not shooting for the moon. I want to manage risk as well.

I am definitely a "total return" investor. I think folks living off their investments may get psychic benefits from "living off the dividends" and thus not spending principal. However, your withdrawals do not care if they are uninvested dividends or sold shares. Ultimately total return is the more important measure IMHO. I have seen enough of the threads on this topic to know you are unlikely to change people's minds on that

I think the best active funds can outperform the broad market.

Full disclosure: don't own VTI or VIG. Very small position on NOBL.
 
I got the analysis to go back to April 1992 by removing index funds (which don't pre-date 1997 apparently) and selecting companies amongst the 106 with longer histories.

DGI still provides 3x more $$ than the benchmark.

https://www.portfoliovisualizer.com/backtest-portfolio?s=y&timePeriod=4&startYear=1985&firstMonth=1&endYear=2017&lastMonth=12&endDate=01%2F20%2F2018&initialAmount=1000000&annualOperation=2&annualAdjustment=40000&inflationAdjusted=true&annualPercentage=0.0&frequency=4&rebalanceType=1&showYield=false&reinvestDividends=true&benchmark=VFINX&symbol1=VITSX&symbol2=BEN&allocation2_2=1&symbol3=GPC&allocation3_2=1&symbol4=HRL&allocation4_2=1&symbol5=JNJ&allocation5_2=1&symbol6=TROW&allocation6_2=1&symbol7=TGT&allocation7_2=1&symbol8=WBA&allocation8_2=1&symbol9=SRCE&symbol10=MMM&allocation10_2=1&symbol11=ABM&allocation11_2=1&symbol12=AFL&allocation12_2=1&symbol13=APD&allocation13_2=1&symbol14=MO&allocation14_2=1&symbol15=AWR&allocation15_2=1&symbol16=WTR&allocation16_2=1&symbol17=ADM&allocation17_2=1&symbol18=T&allocation18_2=1&symbol19=ATO&allocation19_2=1&symbol20=ADP&allocation20_2=1&symbol21=BMI&allocation21_2=1&symbol22=BDX&allocation22_2=1&symbol23=BMS&allocation23_2=1&symbol24=BKH&allocation24_2=1&symbol25=BRC&allocation25_2=1&symbol26=BF-B&allocation26_2=1&symbol27=CWT&allocation27_2=1&symbol29=CSL&allocation29_2=1&symbol30=CVX&allocation30_2=1&symbol31=CINF&allocation31_2=1&symbol32=CTAS&allocation32_2=1&symbol33=CLX&allocation33_2=1&symbol34=KO&allocation34_2=1&symbol35=CL&allocation35_2=1&symbol36=CBSH&allocation36_2=1&symbol37=CBU&allocation37_2=1&symbol38=CTBI&symbol39=CTWS&allocation39_2=1&symbol40=ED&allocation40_2=1&symbol41=DCI&allocation41_2=1&symbol42=DOV&allocation42_2=1&symbol43=EV&allocation43_2=1&symbol44=ECL&allocation44_2=1&symbol45=EMR&allocation45_2=1&symbol46=ERIE&symbol47=XOM&allocation47_2=1&symbol48=FRT&allocation48_2=1&symbol49=THFF&symbol50=FELE&allocation50_2=1&symbol51=GD&allocation51_2=1&symbol52=GRC&symbol53=FUL&allocation53_2=1&symbol54=HP&allocation54_2=1&symbol55=ITW&allocation55_2=1&symbol56=JKHY&allocation56_2=1&symbol57=KMB&allocation57_2=1&symbol58=LANC&allocation58_2=1&symbol59=LEG&allocation59_2=1&symbol60=LOW&allocation60_2=1&symbol61=MKC&allocation61_2=1&symbol62=MCD&allocation62_2=1&symbol63=MGRC&allocation63_2=1&symbol64=MDU&allocation64_2=1&symbol65=MDT&allocation65_2=1&symbol66=MCY&allocation66_2=1&symbol67=MGEE&allocation67_2=1&symbol68=MSEX&allocation68_2=1&symbol69=MSA&allocation69_2=1&symbol70=NC&allocation70_2=1&symbol71=NFG&allocation71_2=1&symbol72=NNN&allocation72_2=1&symbol73=NDSN&allocation73_2=1&symbol74=NWN&allocation74_2=1&symbol75=NUE&allocation75_2=1&symbol76=ORI&allocation76_2=1&symbol77=PH&allocation77_2=1&symbol78=PNR&allocation78_2=1&symbol79=PBCT&allocation79_2=1&symbol80=PEP&allocation80_2=1&symbol81=PPG&allocation81_2=1&symbol82=PG&allocation82_2=1&symbol83=O&symbol84=RLI&allocation84_2=1&symbol85=ROP&allocation85_2=1&symbol86=RPM&allocation86_2=1&symbol87=SPGI&allocation87_2=1&symbol88=SEIC&allocation88_2=1&symbol89=SHW&allocation89_2=1&symbol90=SJW&allocation90_2=1&symbol91=SON&allocation91_2=1&symbol92=SWK&allocation92_2=1&symbol93=SCL&allocation93_2=1&symbol94=SYK&allocation94_2=1&symbol95=SYY&allocation95_2=1&symbol96=TDS&allocation96_2=1&symbol97=TNC&allocation97_2=1&symbol98=TMP&allocation98_2=1&symbol99=TR&allocation99_2=1&symbol100=UGI&allocation100_2=1&symbol101=UMBF&allocation101_2=1&symbol102=UBSI&allocation102_2=1&symbol103=UVV&allocation103_2=1&symbol104=UHT&allocation104_2=1&symbol105=VVC&allocation105_2=1&symbol106=VFC&allocation106_2=1&symbol107=GWW&allocation107_2=1&symbol108=WMT&allocation108_2=1&symbol109=VTSMX&symbol110=VBMFX

I Like it!
and think I'm going to steal it!
 
.... but this is as close as I can get it. Just pick 100 of the 106 companies with 25 year minimum dividend payment history, invest 1% in each of them and get wealthy.

Admittedly, this portfolio does suffer from survivorship bias, ...

Thank you for the efforts (wow - 100 entries!!!), but unfortunately, this cannot just be hand waved away. Survivorship bias can be extremely important.

What we really need (and it seems it should be available, somewhere?) is what I mentioned earlier - the list of recommendations made back at the time - we can look forward from then. That would give us some insight into the (then) predictive capability of this approach.

.... I realize ERD50 is seeking some sort of crystal ball which would make the portfolio selection brainless, ....

As to why an ETF or mutual fund doesn't replicate this performance I cannot really say.

Not necessarily 'brainless', but it should be objective, rule based, and repeatable. If you and I come up with a different list for 2018, and they perform differently over the next 10 years, it's not really a 'system' that anyone can evaluate objectively.

I think the answer as to why an ETF/fund hasn't replicated that performance is in this thread - hint: 48 + 2 = 50.

Now I'm just having a little fun on this next one - but isn't it a little ironic that you said you don't care about the portfolio value, and here you are trying to "prove" something by showing how the portfolio value rose with your picks?

-ERD50
 
Admittedly, this portfolio does suffer from survivorship bias, ...

The selected stocks were found using one and only one qualifier: they have paid dividends every year for more than 25 years.

OK, I re-read that, and yes, I think the bias is going to be extreme, and answers your question about why ETF/funds are not replicating this performance.

To paraphrase, you are saying "give me only the companies that have performed well (and we could use any number of measures for this) for the past 25 years, and I'll show you that they do better than the average of all companies from 25 years ago, including the ones that failed."

Well I'd be shocked if we didn't see outstanding relative performance from such a back-selected group. The problem is, you need a time machine to implement this today. :nonono:


... I think the best active funds can outperform the broad market. ...

I agree. IIRC, I thik the studies say about 15% of them over a 5 year period. But like the above, w/o a time machine we don't know which funds those will be except in the rear view mirror. We can make pretty graphs, but we can't make money with that info.

-ERD50
 
Now that's funny! I use YOUR OWN process and you still try to shoot me down. You just gotta be right! Am I right?

What you're omitting is that the DK50 portfolio and the benchmarks all suffer from the same survivorship bias. Absent a crystal ball or time machine, that's really the best I can do.
 
And don't forget the dividend stickiness. Once the companies get the prestige of being a Dividend Aristocrat, they cannot or will not stop paying them. So in this case the past does predict the future, at least more so than would be expected.
 
Now that's funny! I use YOUR OWN process and you still try to shoot me down. You just gotta be right! Am I right?

What you're omitting is that the DK50 portfolio and the benchmarks all suffer from the same survivorship bias. Absent a crystal ball or time machine, that's really the best I can do.

That's a very different kind of survivorship bias - not the same at all. True, the indexes have it (bad companies fall off after a while), but it is still reporting on what I would have made in all those years of investing in it. The returns to the investor are real.

No, it is not "my process". That is way different from picking a list of stocks today that have been successful for 25 years, and showing how they would have performed if you bought them 25 years ago with your current knowledge that were successful for 25 years - that needs a time machine. A time machine was not required to invest in a broad-based index for the past 25 years.

I've said what we need - the objective recommendations back at the time, and we can see how they did going forward. It's fine if they change the list from time to time, that can be replicated (though it can cause tax considerations). But it has to be going forward from the time the picks were made, which is what those index funds report - not a "what if I invested yesterday in stocks I know are good today".

If you don't see the difference, you need to think on that a while.

-ERD50
 
Last edited:
I agree. IIRC, I thik the studies say about 15% of them over a 5 year period. But like the above, w/o a time machine we don't know which funds those will be except in the rear view mirror. We can make pretty graphs, but we can't make money with that info.

-ERD50

On that I disagree. No one knows what will happen in the future. But you can choose active managers (and strategies) that have worked on the past. And they can continue to do so.

This is no different than what you are saying, which is that dividend strategies, as you choose to define them, have not beaten "the market" in the past, thus there is no reason to assume they will in the future. And you are concluding that by looking at a small segment of performance.

I say, they do not need to beat the market to make aense.
 
And don't forget the dividend stickiness. Once the companies get the prestige of being a Dividend Aristocrat, they cannot or will not stop paying them. So in this case the past does predict the future, at least more so than would be expected.

OK, a report showing how past picks did going forward will include that effect.

Show me.

-ERD50
 
On that I disagree. No one knows what will happen in the future. But you can choose active managers (and strategies) that have worked on the past. And they can continue to do so. ...

I gotta run, maybe someone else can come up with links, but IIRC that is not true. The 15% successful over 5 years funds (or managers) don't generally end up being successful in the next 5 years (forget if it is better/worse than the 15% number). They don't continue to do so. Wellesley and Wellington might be an exception, but there are bound to be some. But they are few and far between. Not so easy to pick.

... This is no different than what you are saying, which is that dividend strategies, as you choose to define them, have not beaten "the market" in the past, thus there is no reason to assume they will in the future. And you are concluding that by looking at a small segment of performance.

I say, they do not need to beat the market to make sense.

I'm not sure I follow? The charts for the div-payers were actually pretty similar to the broad market. I suspect they will continue to pretty much match it, but I have no idea, they may do better or worse in the future. I wouldn't expect a huge variation, just because they are part of the overall market, but anything's possible.

To the last line - bonds, TIPs and CDs don't beat the market but they can still make sense in a portfolio. Not sure what your point is.

-ERD50
 
ERD50,
Thanks for questioning the accepted facts about Dividend funds and backing it up with research. I thought they were safer than an SP500 fund, but they aren't by much. Although VIG and DVY have ten year betas around .85, the three year beta DVY is .64. .85 doesn't hold up in a downturn as well as a .64. But lower betas are normally rewarded with lower earnings at the price of a bit of stability. I just assume they were much safer, less volatile than a large cap fund.
Another accepted truth is when bonds fall due to interest rates rising Dividend stocks also fall. Graphs of BND and DVY don't really show that. Wonder how DVY will perform in a rising rate environment.
Another I've seen is pundits saying over the last few years that DVY has been bid up to high and it's to late in the game to buy. Now that I see that it's actually lagged SPY I'm wondering if the opposite is true.

Thanks for the interesting and informative conversation.
 
Last edited:
I’ve been thinking about this. While intellectually I understand that lots of evidence says that a total return strategy is superior to dividend payers, I’m not clear on how the execution really works in practicality. If your portfolio is throwing off substantial dividend income, there is no need to sell stocks at a loss during downturns. If you don’t hold dividend payers and focus on growth stocks that don’t pay dividends, presumably you will be selling stocks at losses during downturns. While on average over a long period of time, evidence suggests the total return strategy is superior, would you need to hold perhaps a larger percentage of your overall portfolio in cash/bonds to avoid selling equities during a downturn, thereby permanently locking in losses? Or is it just something one accepts as a fact of life that equities will periodically be sold at losses?

If one prefers not to lock in losses by selling during downturns, it seems that either one would have to hold more cash/bonds than one might otherwise do to avoid selling depressed equities during downturns, or dividend paying stocks could be an alternative to increasing the cash/bond allocation. While dividend payers underperform growth stocks, they don’t underperform cash/bonds.

Are there flaws in my thinking here?

During the recession of 2008-2009 my div payers didn’t cut their divs. This was a huge advantage to me but there are other ways to avoid selling in a bad market, ie have lots of cash or FI on hand (I did). But liquidity costs.

The real issue for me is that it’s hard to avoid dividends, especially in Canada(where I live and invest). Many of the established and successful businesses pay and grow dividends. Taxes make divs less attractive for high earners and that’s a real shame (for me). Whether it’s divs per say or more likely simply the fact that many very good companies pay dividends, my div payers have done very well for a long time. But my stock picks are personal and don’t really prove anything.
 
Last edited:
Like you I struggle with this

I’ve been thinking about this. While intellectually I understand that lots of evidence says that a total return strategy is superior to dividend payers, I’m not clear on how the execution really works in practicality. If your portfolio is throwing off substantial dividend income, there is no need to sell stocks at a loss during downturns. If you don’t hold dividend payers and focus on growth stocks that don’t pay dividends, presumably you will be selling stocks at losses during downturns. While on average over a long period of time, evidence suggests the total return strategy is superior, would you need to hold perhaps a larger percentage of your overall portfolio in cash/bonds to avoid selling equities during a downturn, thereby permanently locking in losses? Or is it just something one accepts as a fact of life that equities will periodically be sold at losses?

Are there flaws in my thinking here?

The way I look at it. When you buy the market, you also buy all the pets.com, Enrons, etc, while you buy the home depot's & Netflix's of the world. Some times just a cursory examination of the books of those company's will tell you that they are eventually going to zero. However, you own the market, so you are going to zero with them.

Netflix is an interesting one. I read an article yesterday that they blew it out of the park with more subscriber growth etc., so I looked them up. They have earnings of 5%, and a PE ratio of 247 to 1 IIRC.

Dividends are harder to fake (or talk up) then growth. You need to have a cash flow to pay them out, and there are only two ways to get that cash, through profits or debt. Both of which can be monitored.

This past year is the first time I've gotten serious about it. Prior to that I've concentrated on rentals, and used a dartboard to buy individual stocks.:LOL:

As a result, I'm running several experiments in investing marketable securities. I'm running money through Thomas Partners with Chuck, some ETF's suggested by this group, and my own picks. I'm talking with two additional % asset advisers, and a fee only adviser, just to see what if anything they might be able to bring to the table.

This, along with the many bond threads, have been a good discussion, and it is helping me to learn about the marketable securities world.
 
I’ve been thinking about this. While intellectually I understand that lots of evidence says that a total return strategy is superior to dividend payers, I’m not clear on how the execution really works in practicality. If your portfolio is throwing off substantial dividend income, there is no need to sell stocks at a loss during downturns. If you don’t hold dividend payers and focus on growth stocks that don’t pay dividends, presumably you will be selling stocks at losses during downturns. While on average over a long period of time, evidence suggests the total return strategy is superior, would you need to hold perhaps a larger percentage of your overall portfolio in cash/bonds to avoid selling equities during a downturn, thereby permanently locking in losses? Or is it just something one accepts as a fact of life that equities will periodically be sold at losses?

If one prefers not to lock in losses by selling during downturns, it seems that either one would have to hold more cash/bonds than one might otherwise do to avoid selling depressed equities during downturns, or dividend paying stocks could be an alternative to increasing the cash/bond allocation. While dividend payers underperform growth stocks, they don’t underperform cash/bonds.

Are there flaws in my thinking here?

In practicality, assuming you have a diversified portfolio (anything between 70/30 and 30/70) you would sell FI, not stocks, in a big downturn. Selling bonds/cash would be to fund your WR and to purchase stocks to rebalance.

The scenario you describe is for someone 100% equities. If you are still in the accumulation phase you would ride it out and continue to buy low. If you are 100% stock in the decumulation phase and living off your portfolio you have bigger risk issues than divs/no divs.
 
I’ve been thinking about this. While intellectually I understand that lots of evidence says that a total return strategy is superior to dividend payers, ...

Let's pause here. I personally never said that one 'strategy' was superior over another. All the charts I posted seemed to show that the funds focused on div-payers performed pretty much the same as the broad market. I'm saying that assigning some great benefits to the div-payer sector doesn't seem to be backed by the evidence, or analysis.

And I don't consider "total return" a "strategy", it's arithmetic. Look at the earlier examples, $48 + $2 = $50.

... I’m not clear on how the execution really works in practicality. If your portfolio is throwing off substantial dividend income, there is no need to sell stocks at a loss during downturns. ....

Go back to the excerpts from my post #87. A dividend is essentially the same as the company "selling off" themselves. If they are $50 before their ex-div date, provide a $2 div, and are then $48 ex-div, they essentially "sold" $2 of their stock (compared to the alternative - retaining it as part of their value). If they did not pay a div, and you needed $2, they would have been @ $50, and you could sell 2/50ths of your holdings if/when you needed them, and you control how much, rather than letting the company determine if, when, and how much you would sell.

If you don’t hold dividend payers and focus on growth stocks that don’t pay dividends, ...
I don't, I focus on the broad-based indexes, not any sector.

presumably you will be selling stocks at losses during downturns. While on average over a long period of time, evidence suggests the total return strategy is superior, would you need to hold perhaps a larger percentage of your overall portfolio in cash/bonds to avoid selling equities during a downturn, thereby permanently locking in losses? Or is it just something one accepts as a fact of life that equities will periodically be sold at losses?
IN addition to the other good answers about having your AA (and typical index divs), you are again creating an illusion here - that div payer is also "selling" on a downturn. Remember, the $ either come from the stock or they are retained. There is no magic "fountain of dividends" that come from somewhere else - it's all income, it goes to divs or NAV - there is no other accounting.


-ERD50
 
Last edited:
The way I look at it. When you buy the market, you also buy all the pets.com, Enrons, etc, while you buy the home depot's & Netflix's of the world. Some times just a cursory examination of the books of those company's will tell you that they are eventually going to zero. However, you own the market, so you are going to zero with them. ...

And yet, the studies show that the strategy of just buying the market seems to outperform most stock/sector pickers over time. So while it seems obvious we don't want 'losers' in our portfolio, no one seems to be able to reliably identify the future losers. Some losers do turn around, some winners go on to fail.

Dividends are harder to fake (or talk up) then growth. You need to have a cash flow to pay them out, and there are only two ways to get that cash, through profits or debt. Both of which can be monitored.

Even if we accept that as true, does it matter? Some companies that were paying high dividends went on to cut their divs and fail. Some average-div payers also failed. As I pointed out in the earlier posts, the div isn't "magic money", it's just part of their overall value.

Again, if the divs were such a great indicator, why don't my charts show that?

This past year is the first time I've gotten serious about it. Prior to that I've concentrated on rentals, and used a dartboard to buy individual stocks.:LOL:

As a result, I'm running several experiments in investing marketable securities. I'm running money through Thomas Partners with Chuck, some ETF's suggested by this group, and my own picks. I'm talking with two additional % asset advisers, and a fee only adviser, just to see what if anything they might be able to bring to the table.

This, along with the many bond threads, have been a good discussion, and it is helping me to learn about the marketable securities world.

Nothing funny about the dartboard, that's pretty much what a Total Market Index fund is, they just have lots of darts!

I don't think your experiment will tell you much, too small a sample size, and not enough exposure to various market conditions. Rather than re-invent the wheel, why not just look at the studies that have been done, with a far broader data base than you can put together. Do you really think you can pick out something that 85% of active investors cannot? And do it for the next period as well?

-ERD50
 
This is from Seeking Alpha: The author is Part-Time Investor:
note: redduck is NOT Part-Time Investor

"To make the comparisons accurate, I run three paper portfolios made up of each of the three indices above. For each of these portfolios, whenever I have cash contributions put into my real-life account, I also put the same amount into the paper portfolios and "buy" more shares of the individual indices. And when SPY, SDY or VDIGX pays a dividend, it gets reinvested into more paper shares, just like I reinvest my real-life dividends in my portfolio. As far as I can tell, this is the most accurate way I have to compare their performances.

This year the returns of my(Part-Time Investor) benchmarks were:
SPY - 21.15%
SDY - 12.21%
VDIGX - 18.84%
As a reminder my return was 21.13%
Over the life of the portfolio, which is now a full 5 years, my portfolio continues to beat the S&P and the other benchmarks by a significant amount.
Average Annual Return over the past 5 years (as calculated using the XIRR function on Excel).
KISS - 16.06% (This is Part-Time Investor's portfolio)
SPY (S&P ETF) - 14.70%
SDY (dividend ETF) - 13.55%
VDIGX (Dividend Mutual Fund) - 12.77%"

Part-Time Investor displays his portfolio along with his buys/sells on Seeking Alpha four times a year.
 
Let's pause here. I personally never said that one 'strategy' was superior over another. All the charts I posted seemed to show that the funds focused on div-payers performed pretty much the same as the broad market. I'm saying that assigning some great benefits to the div-payer sector doesn't seem to be backed by the evidence, or analysis.

And I don't consider "total return" a "strategy", it's arithmetic. Look at the earlier examples, $48 + $2 = $50.


Go back to the excerpts from my post #87. A dividend is essentially the same as the company "selling off" themselves. If they are $50 before their ex-div date, provide a $2 div, and are then $48 ex-div, they essentially "sold" $2 of their stock (compared to the alternative - retaining it as part of their value). If they did not pay a div, and you needed $2, they would have been @ $50, and you could sell 2/50ths of your holdings if/when you needed them, and you control how much, rather than letting the company determine if, when, and how much you would sell.

I don't, I focus on the broad-based indexes, not any sector.

IN addition to the other good answers about having your AA (and typical index divs), you are again creating an illusion here - that div payer is also "selling" on a downturn. Remember, the $ either come from the stock or they are retained. There is no magic "fountain of dividends" that come from somewhere else - it's all income, it goes to divs or NAV - there is no other accounting.


-ERD50


I understand in theory, but in practice if one has a portfolio of dividend paying stocks plus some allocation to cash & FI, presumably one can ride out most downturns without taking a real loss. If I had fewer dividends, I think I’d want to have a higher allocation to cash & FI to reduce the risk of incurring real losses. Even if the equity part of the portfolio performed better with a total return strategy, my overall return would be dragged down by holding more cash & FI. So overall, my returns are enhanced by having dividend payers because it enables me to have a more aggressive asset allocation than I otherwise would.

If this thinking is flawed, please help me understand why.
 
Back
Top Bottom