How hard is it to RE at the market top (2014)?

But Joe didn't have $1,000,000 in 2017. That's what he had in 2006 and he's been withdrawing and experiencing investment returns for those intervening years. Maybe in 2017 he had $2,000,000. Then after the 40% crash, he still has $1,200,000. Or maybe not. And what happened after the crash? Perhaps a quick recovery as we've had following the Great Recession? Your example vastly oversimplifies.

Do a FireCalc run and drop the Excel spreadsheets and print them out. Pour a cold, expensive craft beer. Sit in your recliner . Mellow out with the spreadsheets until you understand what's going on. Or, even better, use your laptop instead of a printout so you can fiddle with formulas and try what-ifs.
+1

Good advice, but before you do the above spend some quality time reading and comprehending the information here: FIRECalc - How It Works
 
I love retirement and living off passive income. Eight years in, I can say it's just been great despite the roller coaster ride so far. Retired at a bubble peak, rode out the Great Recession and now am enjoying a really nice ride back up. I expect even more volatility going forward and have no idea whether I'll die broke or worth tens of millions.
Ditto...except I've been riding the roller coaster for an additional year. It's been a great ride so far.
 
See item #3 in my post about "padding" above! ;)

We have a larger nest egg at 100 than we do now without the part time income in the Fidelity RIP.

The Fidelity RIP recommends we change to a more aggressive AA than we have now. One with a potential first year loss of 50%. Why risk losing half our nest egg when we have no need to? I just don't get the logic in doing that.
 
Joe retires in 2106, with $1M and a planned 4% SWR for 30 years with a 94% rate and 75/25 stock bond mix.

In 2017, the market crashes. Joe's portfolio drops 40% to $600,000. Mary wants to retire in 2017 for 29 years with a portfolio of $600,000, and a 75/25 mix and a 4% SWR, but Firecalc says she only has a 43% chance of success.

Are Joe's odds still 94% or have they dropped now to 43%? If they are now 43%, what happened to the 94%? Can Mary retire anyway? Should Joe go back to work? Do they each have different odds of success because Joe pulled the plug one year earlier, even though goiing forward they now both have 600K portfolios, 75/25 AAs, 4% SWR and want to retire for 29 years into the future?

In your example, I think you mean Mary and Joe are both drawing 6.67% WR ($40K/$600K) after the market has crashed. And yes, FIRECalc will now say that Joe's chance is no longer 94%.

It's because FIRECalc does not know nor care whether we are at a market top or bottom. Nor do we, until the top or bottom has already been past. Once the market has dropped precipitously as in 2008-2009, we know that we are if not at a market bottom then very close to one. A retiree drawing 4% or even 6.7% in 2009 should be safe, although he did not feel it.

This is what photoguy mentioned earlier about conditional probability, which incorporates more info once it is available. Following is another example.

According to SSA, a man of 65 years of age today can expect to live till 84. So our friend Joe who is 65 can expect to live to 84, if there is no other information. But suppose he just got the bad news that he has cancer. Now, this sudden new info means that the previous statistics is no longer applicable. What is dominantly important now is the prognosis of his disease. And then, further info when it becomes available will narrow down his fate further, such as what stage of cancer he is at.

So, when we run FIRECalc, can we help not to make a guess as to where we are in the business and market cycle? Or is is even prudent to pretend that we do not know nor care?
 
Last edited:
Well, I won't disagree. A while back I listed a number of the "padding" factors commonly used here on the board by the nervous nellies. I can't remember them all now, but they included:

1. Withdrawal rate well below the FireCalc tested rate for 100% survival.

2. Large pot of cash held outside the retirement portfolio and not included in FireCalc calculations. "Just in case" money.

3. Ongoing part time work or business or spousal income which is not included in FireCalc inputs.

4. Substantial padding of expenses.

5. No accounting for the value of non-financial assets such as an expensive home, summer home, rental properties, antique car collection, millions of dollars of rare art, ownership of the Clippers, etc.

6. Assumed longevity where you're still spending big time at 135 years old.

7. Discounting future SS or not counting it at all. "It'll be gravy."

8. Etc.

I'm most amazed at this type of conservative over doing when the poster, usually in other threads, mentions they don't like their job or their working life and are extremely anxious to quit and get on to a retirement lifestyle. Yet, they'll work extra years to go from a super conservative position to a super-super conservative position or perhaps even the coveted super-super-super conservative position.

It's also interesting to observe how many folks do not look at the distribution of outcomes from FireCalc runs but only focus on the bottom, worse outcome, line. While I've done so many FireCalc runs that I don't do histograms too often anymore, I've done a bunch and they give important insight into the probability of your outcome (based on historical data anyway) given you AA and WR.

To OP:

Beginning withdrawals at a equity market peak is not "hard." It's just another number, another set of circumstances. Make your assumptions, do your testing and get on with life. I wonder if we're at an equity market "peak" now?

Great post. I loved your original post of this list and I love seeing it again. Recognize myself in much of this.

Thanks for your positive message about the journey which cannot be started until we take the first plunge into ER.
 
Youbet,

I agree with your posts and reasoning behind them. I feel comfortable to RE now or later (wherever market wants to be at the time, up or down from now). But market timing in me says I would feel more comfortable to RE if market is coming off of a major downturn. It's all in between my ears right now.
Ah, the market timing approach to retirement. :)

Have you determined how much downturn you will need to be sure it's a major downturn and not a head fake? How you will be able to determine the market is actually coming off the bottom and not playing "gotcha!"?
 
I would take it really simple. With only $600k, if I proceed to withdraw $40k, I can only do that for 15 years before getting into trouble. Significant recovery of the markets would make it better. But my portfolio would have to gain 60% for the old calculations to apply.

I would be looking to move to an extremely lower COL place for a while until the future began to look brighter!
 
But market timing in me says I would feel more comfortable to RE if market is coming off of a major downturn...
So that you would feel more comfortable drawing 4% WR? But 4% after your portfolio has shrunk in a crash is less than 4% of its current value.

If so, how about retiring now on only 3% WR or less, so that when the downturn hits you will get closer to 4%?

Or, are you thinking of going to 100% cash, then when the market has tanked, going back in and ride the market back up while living on 4% of your portfolio value as it is now, but at the market bottom? That would be nice, but that takes perfect market timing!
 
Last edited:
Ah, the market timing approach to retirement. :)

Have you determined how much downturn you will need to be sure it's a major downturn and not a head fake? How you will be able to determine the market is actually coming off the bottom and not playing "gotcha!"?

If I RE now with market hitting record highs, I will be doing it with 3 years of yearly expense in cash account. I also have $300k+ house equity which I can draw from by downsizing. Those will tie me over for up to 6 year of market "stall." Sure, this is not conservative enough to some of your standard but it's a risk I will take when I RE.
 
Ah, the market timing approach to retirement. :)

Have you determined how much downturn you will need to be sure it's a major downturn and not a head fake? How you will be able to determine the market is actually coming off the bottom and not playing "gotcha!"?
+1 Yes! That is the problem when you start to play the timing game.
 
Well, I won't disagree. A while back I listed a number of the "padding" factors commonly used here on the board by the nervous nellies. I can't remember them all now, but they included:

1. Withdrawal rate well below the FireCalc tested rate for 100% survival.

2. Large pot of cash held outside the retirement portfolio and not included in FireCalc calculations. "Just in case" money.

3. Ongoing part time work or business or spousal income which is not included in FireCalc inputs.

4. Substantial padding of expenses.

5. No accounting for the value of non-financial assets such as an expensive home, summer home, rental properties, antique car collection, millions of dollars of rare art, ownership of the Clippers, etc.

6. Assumed longevity where you're still spending big time at 135 years old.

7. Discounting future SS or not counting it at all. "It'll be gravy."

8. Etc.

I'm most amazed at this type of conservative over doing when the poster, usually in other threads, mentions they don't like their job or their working life and are extremely anxious to quit and get on to a retirement lifestyle. Yet, they'll work extra years to go from a super conservative position to a super-super conservative position or perhaps even the coveted super-super-super conservative position.

It's also interesting to observe how many folks do not look at the distribution of outcomes from FireCalc runs but only focus on the bottom, worse outcome, line. While I've done so many FireCalc runs that I don't do histograms too often anymore, I've done a bunch and they give important insight into the probability of your outcome (based on historical data anyway) given you AA and WR.

To OP:

Beginning withdrawals at a equity market peak is not "hard." It's just another number, another set of circumstances. Make your assumptions, do your testing and get on with life. I wonder if we're at an equity market "peak" now?

Ah yes... very accurate. Whenever DW expresses bitterness or anger at MegaCorp for deciding our date for us, I ask her whether in all honesty we would really have had the courage to leave at "our" date on our own impetus. In fact "our" imagined date was just two years later than "their" date... but in my heart I know I would have been a OMY man without the kick up the backside. It hurt then, but feels great now.
 
This is a great discussion. There's no way I would have time for this without being fired.

The double accounting is like this: You are at the bottom of the Great Depression. You take your portfolio balance at that time and enter it into FIRECalc. FIRECalc takes that balance and says, "OK, now what happens to this portfolio if the guy is retiring just before the Great Depression?" Then it proceeds to subject your portfolio to another Great Depression as one of its scenarios. That's not really fair. Two Great Depressions in a row?

Let me respond to your point with multiple comments as I think the discussion is get very nuanced.

1. Why not? People talk about double dip recessions all the time. How bad would things have gotten if the US had defaulted on its debt?

2. Technically your argument hinges on whether there is mean reversion in equity returns (a series of bad returns is much more likely to be followed by good returns and vice versa). As far as I can tell there are conflicting studies as to whether mean reversion actually exists.

Conflicting studies and no-consensus usually means either (1) that it doesn't exist or (2) it exists but is too weak to be practically significant. So I don't think there's any double counting of risk.

3. Even if mean reversion exists, it has to be strong enough to completely negate the extra risk of your equities having tanked 50%. I don't think anybody thinks it's that strong -- if it were it wouldn't be any doubt as to whether it exists.

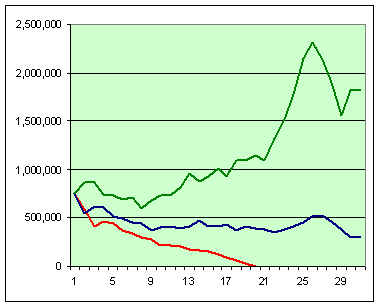
4. Do the following thought experiment: Imagine FIRECALC existed in 1973 and retiree ran it and determined that a 4% withdrawal rate had a failure rate of 5%. As the years pass (the red line in the chart below) and the retiree sees the bad sequence of returns at what point should they update/increase their initial estimate of 5% failure rate? Is that 5% initial failure rate still good after 1 year? after 5 years when the portfolio is now 50%, after 10 years when the portfolio is roughly 1/3 the initial value?

5. I am not saying that the FIRECALC probability computed at the bottom of a bear market is a good estimate of success. Nor am I saying that my calculation method 2 is good either. Both are likely biased pessimistically (we know this from PE10 studies). I am saying that the initial estimate of the failure rate computed before the bear is likely too low now (qualitatively the failure rate should be increasing) given the additional information known.
 

Attachments

  • 73-75.gif
    73-75.gif
    3.6 KB · Views: 126
Last edited:
But Joe didn't have $1,000,000 in 2017. That's what he had in 2006 and he's been withdrawing and experiencing investment returns for those intervening years. Maybe in 2017 he had $2,000,000. Then after the 40% crash, he still has $1,200,000. Or maybe not. And what happened after the crash? Perhaps a quick recovery as we've had following the Great Recession? Your example vastly oversimplifies.

Do a FireCalc run and drop the Excel spreadsheets and print them out. Pour a cold, expensive craft beer. Sit in your recliner . Mellow out with the spreadsheets until you understand what's going on. Or, even better, use your laptop instead of a printout so you can fiddle with formulas and try what-ifs.

I had a typo in my original post. I put he retired in 2106. I meant 2016, so 2017 could be 6 months away, and 2016 may have been flat or not great year as well.

I personally can't see the advantage of risking losing 40 - 50% of our life savings in year one of retirement with a high stock allocation, when my spreadsheets and the Fidelity RIP show we would have more than we started with in inflation adjusted dollars and would still be saving money past age 100 with very little in stocks. I personally would just rather just spend less and not take on a lot of risk. YMMV.

I like reading up on the different happiness studies that have been published lately and I do not think spending past a certain point would make us any happier, but stress over losing a lot of money in the stock market or not having enough to pay for medical bills or long term care would make us very unhappy.
 
So, when we run FIRECalc, can we help not to make a guess as to where we are in the business and market cycle? Or is is even prudent to pretend that we do not know nor care?

I'm pretty sure Pfau has some papers that accounts for PE10 in the SWR calculations. However I don't know of any online tools that incorporate this.
 
The double accounting is like this: You are at the bottom of the Great Depression. You take your portfolio balance at that time and enter it into FIRECalc. FIRECalc takes that balance and says, "OK, now what happens to this portfolio if the guy is retiring just before the Great Depression?" Then it proceeds to subject your portfolio to another Great Depression as one of its scenarios. That's not really fair. Two Great Depressions in a row?
People talk about double dip recessions all the time. How bad would things have gotten if the US had defaulted on its debt?
Probably very, very bad, but this is a discussion about FIRECalc (at least I think it is...) and FIRECalc looks at history as it actually happened, not history as it might have happened. Animorph is correct, adding a second major downturn on top of the worst in history already included in FIRECalc invalidates what the calculator was designed to do.
 
Last edited:
This is a great discussion. There's no way I would have time for this without being fired.


Let me respond to your point with multiple comments as I think the discussion is get very nuanced.

1. Why not? People talk about double dip recessions all the time. How bad would things have gotten if the US had defaulted on its debt?

It's not that it's a double dip, it's that the present day market dip is being added to the front of every historical market dip (including doubles) during your FIRECalc testing. Making them all worse, and possibly affecting many scenarios.

2. Technically your argument hinges on whether there is mean reversion in equity returns (a series of bad returns is much more likely to be followed by good returns and vice versa). As far as I can tell there are conflicting studies as to whether mean reversion actually exists.

Conflicting studies and no-consensus usually means either (1) that it doesn't exist or (2) it exists but is too weak to be practically significant. So I don't think there's any double counting of risk.

Yeah, I like mean reversion. I see it in every market recovery. Except bubbles. It's also a good reason to use FIRECalc. If there is mean reversion, it's in there.

3. Even if mean reversion exists, it has to be strong enough to completely negate the extra risk of your equities having tanked 50%. I don't think anybody thinks it's that strong -- if it were it wouldn't be any doubt as to whether it exists.

We've just seen a really good example of it since 2008. At 10%/year we should only be up 61% from the bottom, not hitting new highs. I suspect emotion, uncertainty, and panic has quite a bit to do with prices being lower than they should be at the bottom and then recovering faster than 10%/year when things turn out OK. No, it's not all mean reversion, but I think it is a significant factor in many cases. Now, Japan or NASDAQ are certainly arguments that there are other factors at play.

4. Do the following thought experiment: Imagine FIRECALC existed in 1973 and retiree ran it and determined that a 4% withdrawal rate had a failure rate of 5%. As the years pass (the red line in the chart below) and the retiree sees the bad sequence of returns at what point should they update/increase their initial estimate of 5% failure rate? Is that 5% initial failure rate still good after 1 year? after 5 years when the portfolio is now 50%, after 10 years when the portfolio is roughly 1/3 the initial value?

Or it's 1983 and the success rate looks terrible, but a big stock market pop is coming in the future? FIRECalc is a very blunt instrument. These 5% failure rates are the result of something like 6 failed years out of 120. Our rule of thumb in digital communications was that you needed at least 10 failures to get a reasonable error rate estimate. There is not enough data for FIRECalc to sharpen its results given a fixed set of initial retirement year's performance. In the 1973 case it has no good guidance for you.

If you think it's OK to use FIRECalc with your March 2009 portfolio value, the interpretation of the results is up to you. It's only a tool that does what it does.

5. I am not saying that the FIRECALC probability computed at the bottom of a bear market is a good estimate of success. Nor am I saying that my calculation method 2 is good either. Both are likely biased pessimistically (we know this from PE10 studies). I am saying that the initial estimate of the failure rate computed before the bear is likely too low now (qualitatively the failure rate should be increasing) given the additional information known.

I agreed with that before. The additional information would indicate you are on a higher failure rate path. It's just that FIRECalc can't use that additional information in a meaningful way, nor do we really have enough historical data to be statistically relevant even if FIRECalc could do it.

If you believe mean reversion is a total crock, then I think running FIRECalc fresh each year would make sense. But what would your chart look like if you started at October 10, 2007, ran through March 2009, and then continued on with your chart? Worse than the Great Depression? If that's one of your FIRECalc failure scenarios is it really relevant? In this case (entering a March 2009 portfolio value) FIRECalc will be lowballing your success rate.

Historically, and by definition, the really bad market dips were preceded by market peaks. Why modify that by entering an already depleted portfolio number as the peak portfolio value before those dips?
 
Great thread. I find the "debate" aspect to be the most educational, informative, and thought-provoking. Thanks to all for their input.

I concur with photoguy regarding the Pfau/Kitces paper and research being academic and too new for my tastes. While I intend to decrease my equity portion at beginning of retirement, and increase 5 years in (depending), it will only vary by 5% max. Personally, I wouldn't be comfortable increasing equity allocation at 80 years old or beyond. This failure to adequately address the psychological/emotional aspect of the glide path approach has been one of its critiques.
 
Last edited:
From Michael Kitces in 2012:
(Summary- the 4% SWR is based on the worst case scenario in history and that scenario was really really horrible and it still works)

"The average real return on a 60/40 (re-)balanced portfolio associated with the worst safe withdrawal rate scenarios in history was a mere 0.86% average annual compound growth rate over the first 15 years of retirement. In point of fact, this was actually driven by a slightly negative real return in bonds (at -0.15%) and a slightly positive real return in equities of 0.73% (the reason the rebalanced portfolio returns were slightly higher than the returns of stocks or bonds separately was due to the favorable market timing of some of the rebalancing trades)...

Viewed another way, what the data shows is that if you expect the coming safe withdrawal rates from here to be worse than anything seen in history, you need to assume not just below-average returns; you need to assume that the stock market cannot generate more than 1% real returns between now [ed-2012] and 2027 given a 15-year real bond return of 0% at todays rates, and that if inflation increases from here that equities will fail to increase dividends dollar payouts, grow earnings, or provide any effective hedge to inflation whatsoever.

...if you believe that equities will fail to deliver even a 1% real return over the next 15 years, ...[this implies] (given current dividend and inflation levels) that the S&P 500 price level will be lower in 2027 than it was in 2007 (which would also be lower than it was in 2000, resulting in no appreciation for 27 years!)."

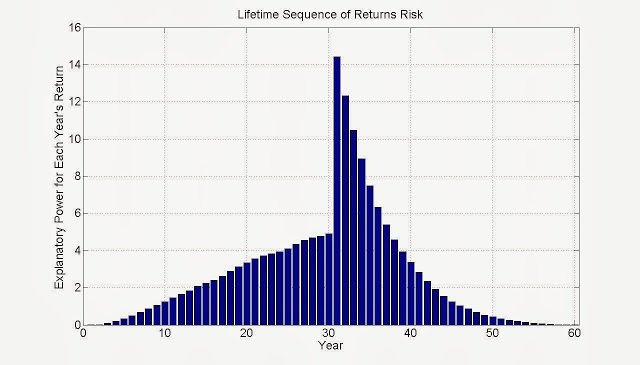
Also regarding the impact of early years - from Wade Pfau's blog:
ImageUploadedByEarly Retirement Forum1402973434.604528.jpg
This shows the proportional influence of each year's returns on success--30 years of accumulation and then withdrawals from year 31- so the returns in the first year of withdrawals has the largest impact on with the returns accounting for 14% of the success of the portfolio...each year after that, the returns matter less and less...
 
I dunno. I retired in early 2008, and had to rebalance in Feb 2009 when the market fluctuated a bit. Since my plan also calls for tax loss harvesting, I did that then, too.

The portfolio seems to be OK. I just had to rebalance again in 2013, which used up a bit of those harvested losses. I have wide rebalancing bands, and the plan calls for checking once a year in February and rebalancing just enough to get me within the bands.

So it goes. So it goes...
 
"The average real return on a 60/40 (re-)balanced portfolio associated with the worst safe withdrawal rate scenarios in history was a mere 0.86% average annual compound growth rate over the first 15 years of retirement. In point of fact, this was actually driven by a slightly negative real return in bonds (at -0.15%) and a slightly positive real return in equities of 0.73% (the reason the rebalanced portfolio returns were slightly higher than the returns of stocks or bonds separately was due to the favorable market timing of some of the rebalancing trades)...

Viewed another way, what the data shows is that if you expect the coming safe withdrawal rates from here to be worse than anything seen in history, you need to assume not just below-average returns; you need to assume that the stock market cannot generate more than 1% real returns between now [ed-2012] and 2027 given a 15-year real bond return of 0% at todays rates, and that if inflation increases from here that equities will fail to increase dividends dollar payouts, grow earnings, or provide any effective hedge to inflation whatsoever.

...if you believe that equities will fail to deliver even a 1% real return over the next 15 years, ...[this implies] (given current dividend and inflation levels) that the S&P 500 price level will be lower in 2027 than it was in 2007 (which would also be lower than it was in 2000, resulting in no appreciation for 27 years!)."

Ouch! I guess that's a reason for diversification beyond bonds & stocks.

Japan's Nikkei index in 1990 was near 40000. Some 24 years later, it is at 15000. I don't think their bond returned much during that period either.
 
Ouch! I guess that's a reason for diversification beyond bonds & stocks.

Japan's Nikkei index in 1990 was near 40000. Some 24 years later, it is at 15000. I don't think their bond returned much during that period either.

This raises another interesting point. The SWR studies are basically studies of investing in the USA...a more diversified portfolio of emerging markets and international markets should provide some decrease in correlation and thus better results with less volatility ---in theory.

The cautionary tale of Japan is also incompletely told here. Along with those dismal cumulative returns there has been significant deflation, so your lower buying power would not have deteriorated as much as it feels like it would in our inflation-minded world...also, not every year was down-it has a sawtooth pattern with no more than three consecutive down years...and some great years (up 23% in 2012, up 27% in 2013 and up 43+% in 2005 and none of this includes dividends). so there could be some better performance by a rebalancing strictly Japanese investor over that horrible Japanese market time frame...(I saw one study that showed a 50/50 AA with quarterly rebalancing in and out of equity-- all in the Nikkei over this horrible period --would yield CAGR of 1.8%)
 
Last edited:
I think a bit of perspective is order. We have roughly 40 million American over the age 65, I am sure that the vast majority of them retired. I bet we have hundreds of million of people retire since WW2, and only tiny percentage of them used tools like FIRECalc.

The over 65 group has the lowest percentage of any age who live in poverty. So somehow all this people retired without running out of money. Kinda of hard to imagine when you think about it :)
 
Much of the world was devastated after WWII. Yet, people survived.

If and when the going gets tough, retirees will stop traveling, ordering from Amazon, going out to eat, buying fancy cars, etc... It's not the end of the world.
 
Back
Top Bottom