This is a great discussion. There's no way I would have time for this without being fired.
Let me respond to your point with multiple comments as I think the discussion is get very nuanced.
1. Why not? People talk about double dip recessions all the time. How bad would things have gotten if the US had defaulted on its debt?
It's not that it's a double dip, it's that the present day market dip is being added to the front of every historical market dip (including doubles) during your FIRECalc testing. Making them all worse, and possibly affecting many scenarios.
2. Technically your argument hinges on whether there is mean reversion in equity returns (a series of bad returns is much more likely to be followed by good returns and vice versa). As far as I can tell there are conflicting studies as to whether mean reversion actually exists.
Conflicting studies and no-consensus usually means either (1) that it doesn't exist or (2) it exists but is too weak to be practically significant. So I don't think there's any double counting of risk.
Yeah, I like mean reversion. I see it in every market recovery. Except bubbles. It's also a good reason to use FIRECalc. If there is mean reversion, it's in there.
3. Even if mean reversion exists, it has to be strong enough to completely negate the extra risk of your equities having tanked 50%. I don't think anybody thinks it's that strong -- if it were it wouldn't be any doubt as to whether it exists.
We've just seen a really good example of it since 2008. At 10%/year we should only be up 61% from the bottom, not hitting new highs. I suspect emotion, uncertainty, and panic has quite a bit to do with prices being lower than they should be at the bottom and then recovering faster than 10%/year when things turn out OK. No, it's not all mean reversion, but I think it is a significant factor in many cases. Now, Japan or NASDAQ are certainly arguments that there are other factors at play.
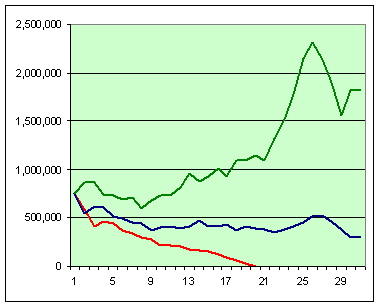
4. Do the following thought experiment: Imagine FIRECALC existed in 1973 and retiree ran it and determined that a 4% withdrawal rate had a failure rate of 5%. As the years pass (the red line in the chart below) and the retiree sees the bad sequence of returns at what point should they update/increase their initial estimate of 5% failure rate? Is that 5% initial failure rate still good after 1 year? after 5 years when the portfolio is now 50%, after 10 years when the portfolio is roughly 1/3 the initial value?
Or it's 1983 and the success rate looks terrible, but a big stock market pop is coming in the future? FIRECalc is a very blunt instrument. These 5% failure rates are the result of something like 6 failed years out of 120. Our rule of thumb in digital communications was that you needed at least 10 failures to get a reasonable error rate estimate. There is not enough data for FIRECalc to sharpen its results given a fixed set of initial retirement year's performance. In the 1973 case it has no good guidance for you.
If you think it's OK to use FIRECalc with your March 2009 portfolio value, the interpretation of the results is up to you. It's only a tool that does what it does.
5. I am not saying that the FIRECALC probability computed at the bottom of a bear market is a good estimate of success. Nor am I saying that my calculation method 2 is good either. Both are likely biased pessimistically (we know this from PE10 studies). I am saying that the initial estimate of the failure rate computed before the bear is likely too low now (qualitatively the failure rate should be increasing) given the additional information known.
I agreed with that before. The additional information would indicate you are on a higher failure rate path. It's just that FIRECalc can't use that additional information in a meaningful way, nor do we really have enough historical data to be statistically relevant even if FIRECalc could do it.
If you believe mean reversion is a total crock, then I think running FIRECalc fresh each year would make sense. But what would your chart look like if you started at October 10, 2007, ran through March 2009, and then continued on with your chart? Worse than the Great Depression? If that's one of your FIRECalc failure scenarios is it really relevant? In this case (entering a March 2009 portfolio value) FIRECalc will be lowballing your success rate.
Historically, and by definition, the really bad market dips were preceded by market peaks. Why modify that by entering an already depleted portfolio number as the peak portfolio value before those dips?
")