I thought this article on Bloomberg by one of the architects of DFA's retirement income funds was well worth the read:
https://www.bloomberg.com/opinion/articles/2021-05-14/retirement-savings-may-not-go-as-far-as-you-think
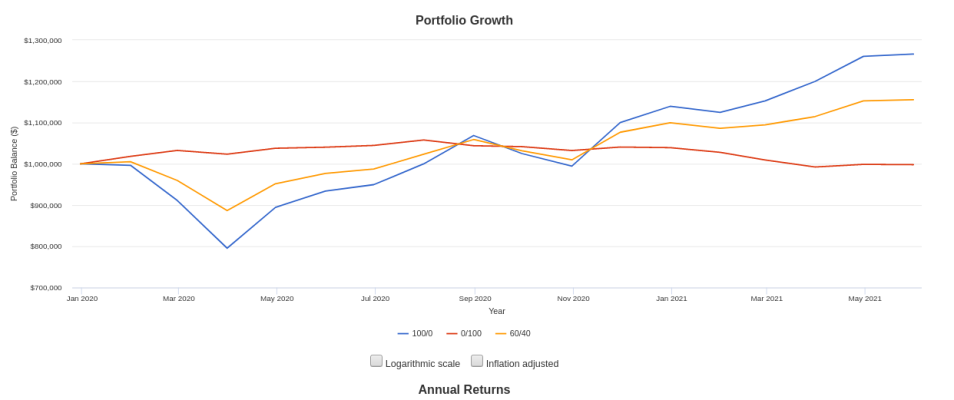
For those contemplating (or already in) ER it can be easy to miss the fact that the recovery in equities since last March's deep dive has been more than offset by declining interest rates on the bond side for any remotely balanced portfolio - and safe withdrawal rates going forward will have to be much lower (and/or one has to accumulate a much larger nest egg).
I learned of this piece in a long (and worthwhile IMHO) thread on Bogleheads started by a guy who knows the world of pensions and annuities inside and out. If nothing else, this particular post by him midway through the first page of the discussion is a tour-de-force deconstruction of the 4% "rule" (or guideline, which is of course all the Trinity study authors intended it to be) as a tool for use in the real world - along with great links to much better tools:
https://www.bogleheads.org/forum/viewtopic.php?p=6039678#p6039678
You know that things have gotten truly weird when even the Bogleheads crowd is talking openly about options like buying single-premium immediate annuities and iBonds and dabbling in gold ETFs. Such is the new negative real return bond world we live in, and withdrawal methods based on very different assumptions (like the old 50:50 used by Bengen et al) could quite possibly end up being dangerous relics of the past.
https://www.bloomberg.com/opinion/articles/2021-05-14/retirement-savings-may-not-go-as-far-as-you-think
For those contemplating (or already in) ER it can be easy to miss the fact that the recovery in equities since last March's deep dive has been more than offset by declining interest rates on the bond side for any remotely balanced portfolio - and safe withdrawal rates going forward will have to be much lower (and/or one has to accumulate a much larger nest egg).
I learned of this piece in a long (and worthwhile IMHO) thread on Bogleheads started by a guy who knows the world of pensions and annuities inside and out. If nothing else, this particular post by him midway through the first page of the discussion is a tour-de-force deconstruction of the 4% "rule" (or guideline, which is of course all the Trinity study authors intended it to be) as a tool for use in the real world - along with great links to much better tools:
https://www.bogleheads.org/forum/viewtopic.php?p=6039678#p6039678
You know that things have gotten truly weird when even the Bogleheads crowd is talking openly about options like buying single-premium immediate annuities and iBonds and dabbling in gold ETFs. Such is the new negative real return bond world we live in, and withdrawal methods based on very different assumptions (like the old 50:50 used by Bengen et al) could quite possibly end up being dangerous relics of the past.