2010's done, where now? ... decades charts

Lsbcal

Give me a museum and I'll fill it. (Picasso) Give me a forum ...
Joined
May 28, 2006
Messages
8,809
Location
west coast, hi there!
I updated my decades chart for the 2010's closeout. Nice run and it is encouraging to me that the slope for the 2010's (see BLUE line) has been pretty constant over recent years. Sorry chart is a little cluttered but how else to show the wild rides over various decades?
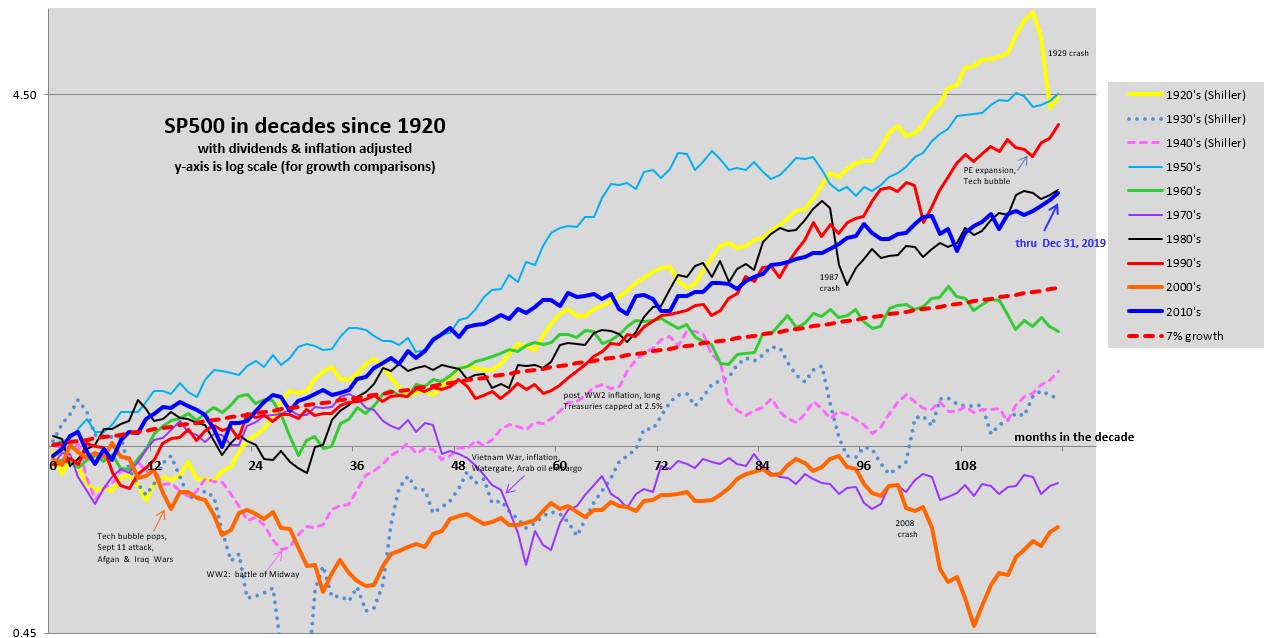
image1.jpg


Since my investment lifetime starts in the 1970's, I trimmed off the prior decades to show just 5 decades:
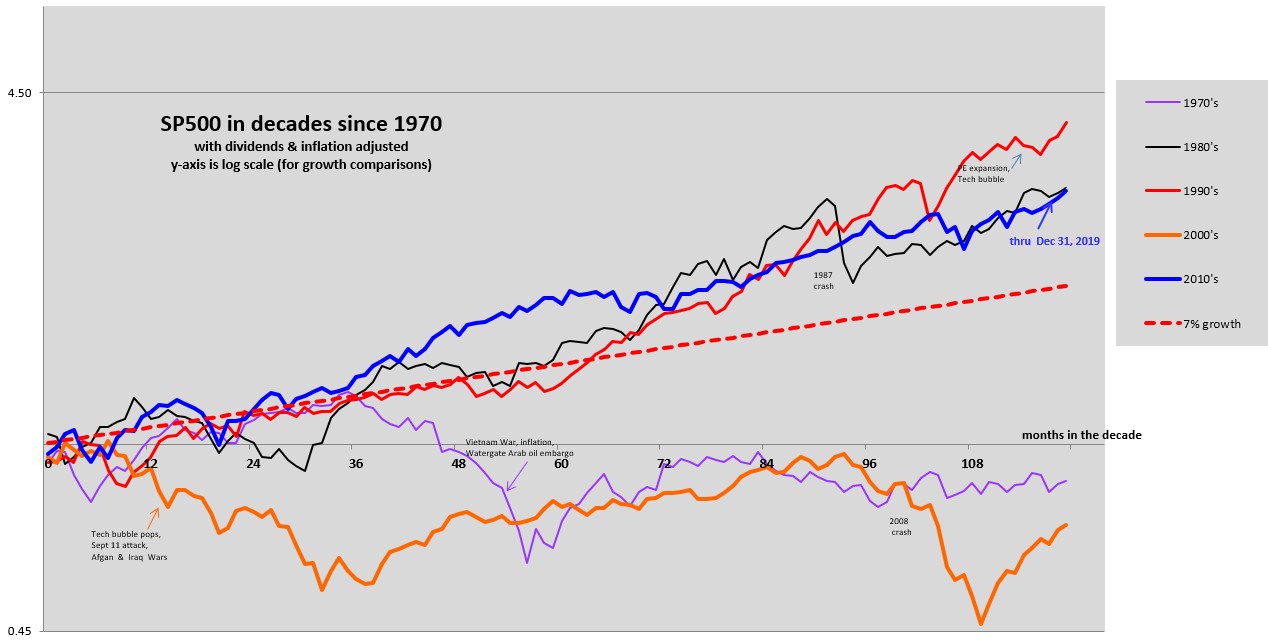
image2.jpg


Go ahead, tell us what we should expect for the 2020's. I won't hold you to it.
 
I'm trying to visualize the decade lines all contiguous and where we would be, having invested over the duration compared to the 7% 'standard' line.
 
Wow, impressive, pretty much matched the famous 1980s!

I haven’t gotten my mojo back yet - the future is blank.
 
Last edited:
Very nice, as always, Lsbcal! Thanks.

Go ahead, tell us what we should expect for the 2020's. I won't hold you to it.

Since my crystal ball is still malfunctioning, I pulled out all the stops; I checked my most secret, valuable source of information and found the answer. Here you go:
 

Attachments

  • Capture.JPG
    Capture.JPG
    16.5 KB · Views: 93
The bookend events of the 2000s give that decade a bum rap. You could pick another arbitrary 10-year period and the slopes would smooth out significantly.
 
where to now?

I'm going back 10 years and changing my AA to better take advantage of the decade long bull market.
 
I get the feeling the market will not be allowed to go down until after November 2020.:cool:
 
Lsbcal impressive visual chart! Thanks for this...

I feel and this is a gut...I've only been alive since the 80s...that we are approaching 80s and 90s territory. Will it be better or worse? Only by a little, that is my prediction so somewhere slightly above where the 80s landed or slightly below where the 90s landed.
 
Back
Top Bottom