Lsbcal
Give me a museum and I'll fill it. (Picasso) Give me a forum ...
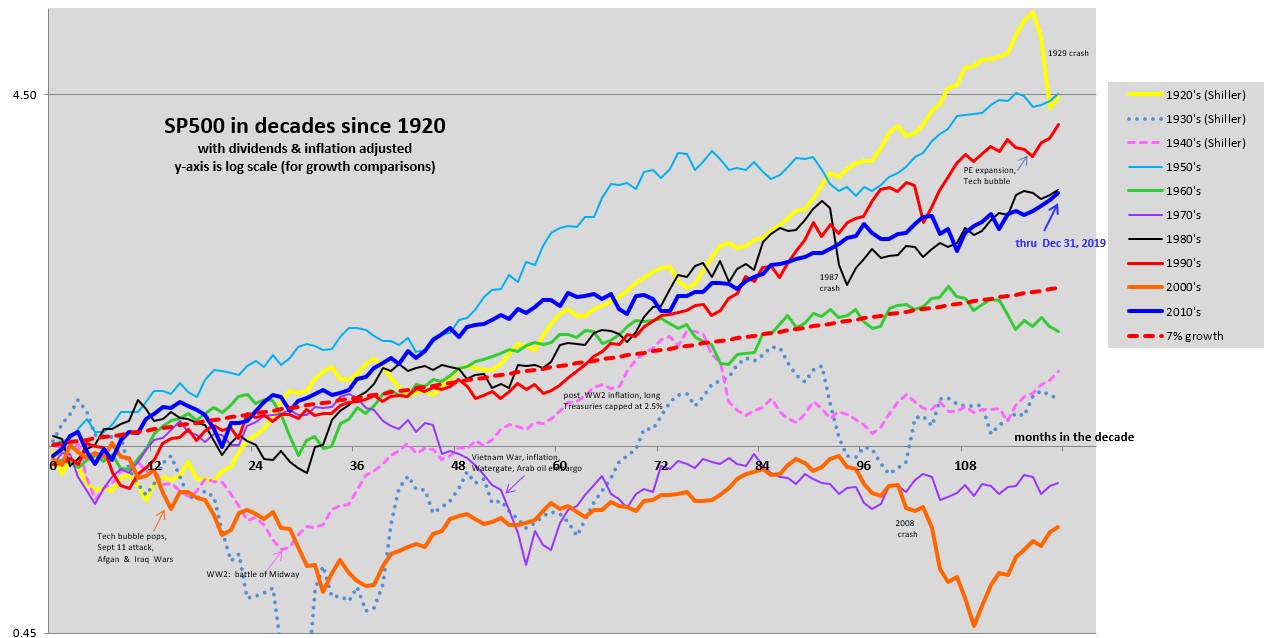
I updated my decades chart for the 2010's closeout. Nice run and it is encouraging to me that the slope for the 2010's (see BLUE line) has been pretty constant over recent years. Sorry chart is a little cluttered but how else to show the wild rides over various decades?
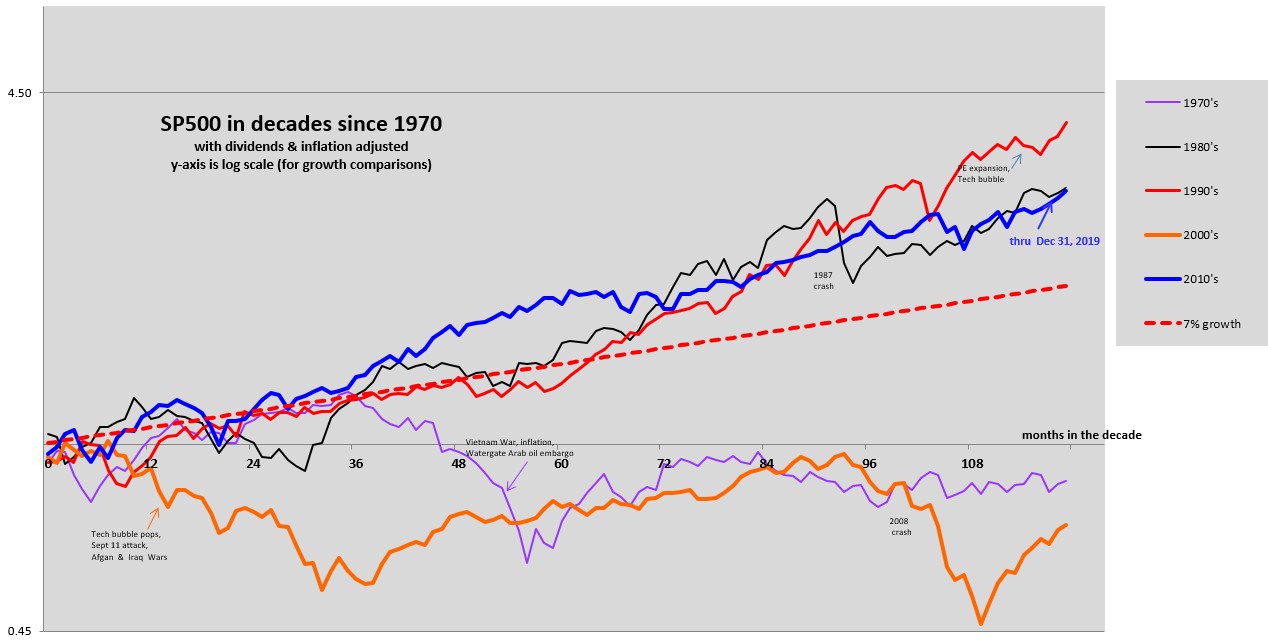
Since my investment lifetime starts in the 1970's, I trimmed off the prior decades to show just 5 decades:
Go ahead, tell us what we should expect for the 2020's. I won't hold you to it.
Since my investment lifetime starts in the 1970's, I trimmed off the prior decades to show just 5 decades:
Go ahead, tell us what we should expect for the 2020's. I won't hold you to it.
")