Is the Stock Market Cheap?

Midpack

Give me a museum and I'll fill it. (Picasso) Give me a forum ...
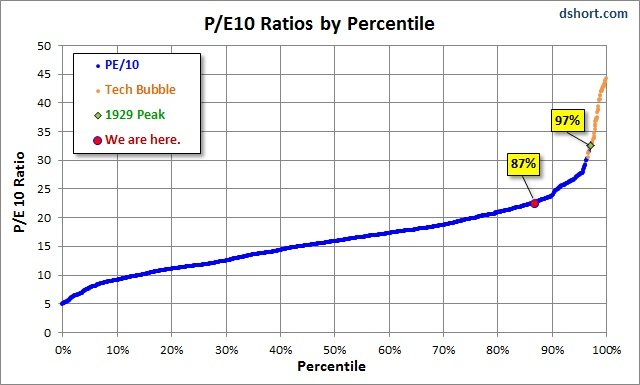
Joined
Jan 21, 2008
Messages
21,327
Location
NC

Attachments

  • image.jpg
    image.jpg
    62.7 KB · Views: 59
Last edited:
A good article well worth reading.. It certainly reinforces my belief that stocks aren't cheap. On the other hand as always the real question isn't the valuation of stocks in absolute terms but on a relative terms. I don't really need any fancy P/E 10 charts to know the answer to the question are bonds cheap? hell no. Real estate, probably so but it is a pain in the butt to own. Commodities: oil, gold, silver etc I have no idea.
 
I'll be more worried if that article, published on April Fool Day, was titled "The Stock Market is Cheap".
 
Well what is E? last 12 months, next 12 months a combination?
 
I've been putting off rebalancing after retirement because bonds are so overpriced but think now is a good time to sell stocks and move to cash, CDs to get near my desired AA. Want to go from 80 percent equity to 65%. I am going to stay away from bonds. I feel a large correction in stocks will rebound in a few years where as little as a 10% loss in bond funds would take longer to recoup.
 
That is a good article. I read a Schiller related discussion that I have never been able to find again that counseled using PE/10 to calculate a starting SWR. The standard approach is 1/PE/10 (e.g. at 22.5 as per the article, SWR would be 4.4) but the discussion recommended using a lower numerator of .83 consistent with discussions of the new normal (.83 would lead to a 3.6% starting SWR in the above situation). I keep a .83/PE10 line in my portfolio spreadsheet to see what this market valuation approach would tell me today's situation merits. Current Schiller PE/10 is available online.
 
Last edited:
That is a good article. I read a Schiller related discussion that I have never been able to find again that counseled using PE/10 to calculate a starting SWR. The standard approach is 1/PE/10 (e.g. at 22.5 as per the article, SWR would be 4.4) but the discussion recommended using a lower numerator of .83 consistent with discussions of the new normal (.83 would lead to a 3.6% starting SWR in the above situation). I keep a .83/PE10 line in my portfolio spreadsheet to see what this market valuation approach would tell me today's situation merits. Current Schiller PE/10 is available online.
I've seen several, so unlikely I will find the one you're recalling but...

Another Look at Safe Withdrawal Rates and PE Ratios

Withdrawal Rates, Savings Rates, and Valuation-Based Asset Allocation
 
Dow future is down over 150 points in reaction to a report of continuing weak job growth. Oh joy.
 
Nope, I have seen those. They primarily address asset allocation and PE/10. The discussion I remember addressed starting SWR (using the old standby start plus inflation approach) based on a PE/10 evaluation of the starting market valuation. IIRC correctly the 1 or .83 divided by PE/10 was applied to an unvarying 50/50 allocation.

I don't use any of this to determine my actual withdrawal rate, I just keep a cell in a spreadsheet as an interesting factoid about what the concept would counsel as a starting SWR as of today. Kind of reassuring that it has stayed significant;y higher than my actual withdrawals - but that could change with a 50% market crash.
 
I'm not sure the market is "cheap", though it's cheaper today than it was a few days ago...

I take some of the blame, as I finally sold junk and corp bond funds, and added some to equities and REIT, in perfect tune with the recent highs. :cool:

Having said that, I plan to stand pat for a long while, with no more [-]dirty market timing[/-] strategic rebalancing... :rolleyes:
 
I know these are academics that try to come up with a valuation of the market... what I would like to know is if the market is actually good at predicting future growth:confused:


IOW, P/E 10, as someone else mentioned, is a trailing indicator... but when you buy stocks, you are buying future income (either dividends or capital growth).... so, if the market is about to go on a 10 year income spree, the market is not overpriced... but if the market is going to muddle along... then maybe it is...

However, we will not know for sure until the 10 years are up...

So, has anybody actually looked at the stock price based on the future earnings of a company:confused: I doubt it...

Another problem with this view is that companies now can grow fast... Google and Facebook were not companies 10 years ago... Google is worth over $250 billion, Facebook over $64 billion...
 
So, has anybody actually looked at the stock price based on the future earnings of a company:confused: I doubt it...
PEs based on next 4 quarters estimated earnings are very easy to find.

THE problem is that they are useless. Estimated earnings can't predict actual earnings, so how could PEs based on them have any validity?

IMO the difficulties with trailing earnings are mostly imaginary.

Ha
 
My problem with using PE/10 right now is the massive losses in 2009 distort the measure.

Will stocks suddenly become more valuable in 2019 when that year falls off the PE/10 measurement?

Nope, I have seen those. They primarily address asset allocation and PE/10. The discussion I remember addressed starting SWR (using the old standby start plus inflation approach) based on a PE/10 evaluation of the starting market valuation. IIRC correctly the 1 or .83 divided by PE/10 was applied to an unvarying 50/50 allocation.

I don't use any of this to determine my actual withdrawal rate, I just keep a cell in a spreadsheet as an interesting factoid about what the concept would counsel as a starting SWR as of today. Kind of reassuring that it has stayed significant;y higher than my actual withdrawals - but that could change with a 50% market crash.
 
PEs based on next 4 quarters estimated earnings are very easy to find.

THE problem is that they are useless. Estimated earnings can't predict actual earnings, so how could PEs based on them have any validity?

IMO the difficulties with trailing earnings are mostly imaginary.

Ha


No, not the future estimates, but the actual numbers after the fact...

IOW, we know what the stock price was in 1990.... we know what it earned in the 90s... so, was the price in 1990 correct for what was earned in the 90s:confused: Same with 1991 and earning from 1991 to 2001...
 
My problem with using PE/10 right now is the massive losses in 2009 distort the measure.

Will stocks suddenly become more valuable in 2019 when that year falls off the PE/10 measurement?

Did they become more valuable over the last couple of years as 2001/2002 fall off the measurement?
I don't see any big distortions on the P/E10 chart.
 
Did they become more valuable over the last couple of years as 2001/2002 fall off the measurement?
I don't see any big distortions on the P/E10 chart.


A 10 year average will smooth a lot of big swings....


I see the correlation, but I do not see how it help determine the direction of the market in the short term.... meaning the next year...


It also does not measure the relationship of value with other possible investments.... IOW, the market might be overvalued based on historical norms, but what is a good alternative:confused: Bonds appear to be a lot more overvalued.... gold even more....

So what are you supposed to do with this knowledge:confused:
 
No, not the future estimates, but the actual numbers after the fact...

IOW, we know what the stock price was in 1990.... we know what it earned in the 90s... so, was the price in 1990 correct for what was earned in the 90s:confused: Same with 1991 and earning from 1991 to 2001...
So you are not looking for a valuation tool, but instead an historical tool? You want to know if PE in 1990 predicted after the fact earnings in 1991?
 
A 10 year average will smooth a lot of big swings....


I see the correlation, but I do not see how it help determine the direction of the market in the short term.... meaning the next year...
Shiller does not claim that it will. He thinks that nothing will do this, and I agree.

His data do show that PE 10 predicts returns for the following 10 years. Why do we claim to be long term investors, then go looking for away to predict next year?

Markets rarely deviate for long from trend line. When they do, it may be an usually large deviation from the same trend, or it may be that a new trend line, based on new conditions, is forming. That's the inescapable puzzle of return to the mean strategies.

Ha
 
It also does not measure the relationship of value with other possible investments.... IOW, the market might be overvalued based on historical norms, but what is a good alternative:confused: Bonds appear to be a lot more overvalued.... gold even more....

So what are you supposed to do with this knowledge:confused:
Some folks might propose holding much higher levels of cash/cash equivalents if equities AND bonds appear overvalued. They would favor taking the short-term hit on returns (even accepting negative real returns) in order to buy in cheaply when prices return to their historic levels.
But we're very close to h***s territory with this approach. And DMT*, too.

*Dirty Market Timing
 
Dow future is down over 150 points in reaction to a report of continuing weak job growth. Oh joy.
It's not just me. A lot of folks I know have been whacked in the last few weeks (or their significant others). I'm seeing more layoffs now than I personally saw in the '08-09 meltdown (and not just me or my colleagues; I would have said the same a week ago).

Wall Street still expects double digit earnings growth when revenues just aren't growing at that pace, and the corporate world has trimmed the fat, most of the meat and is now cutting expenses into the bone in order to appease shareholder expectations *this quarter*.

The bottom line is that 10% earnings growth with 3-4% long-term revenue growth is simply not sustainable in the long term, but most corporate HQs aren't as interested in the long term as they are with this quarter.
 
So you are not looking for a valuation tool, but instead an historical tool? You want to know if PE in 1990 predicted after the fact earnings in 1991?


In a way, yes.... a tool like PE/10 or even PE does not mean much if it can not be used to make informed decisions...

Since we have history, it would be interesting to see if there were any predictive value to this number... or is it just some interesting calculations that someone makes... with no meaning....
 
Some folks might propose holding much higher levels of cash/cash equivalents if equities AND bonds appear overvalued. They would favor taking the short-term hit on returns (even accepting negative real returns) in order to buy in cheaply when prices return to their historic levels.
But we're very close to h***s territory with this approach. And DMT*, too.

*Dirty Market Timing


But does it tell you when to get into the market:confused: I don't think so...


I do a bit of DMT on the side... but in reality my %s do not change much... my DMT is with such small money it really does not make a big difference.... just makes me feel better....
 
Back
Top Bottom