Here's a really interesting article discussing PE10 and some of it criticisms (and defenses) by Asness:
http://www.aqr.com/Portals/1/ResearchPapers/ShillerPECommentary_AQRCliffAsness.pdf
Some excerpts:
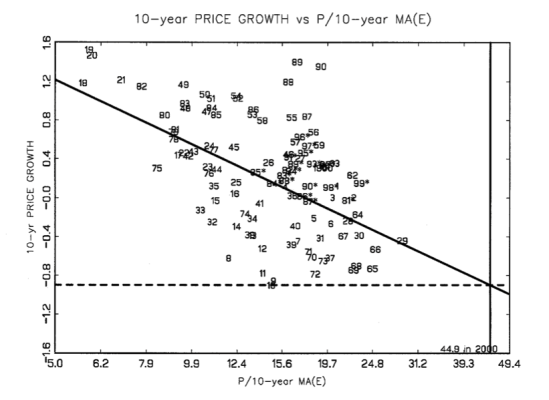
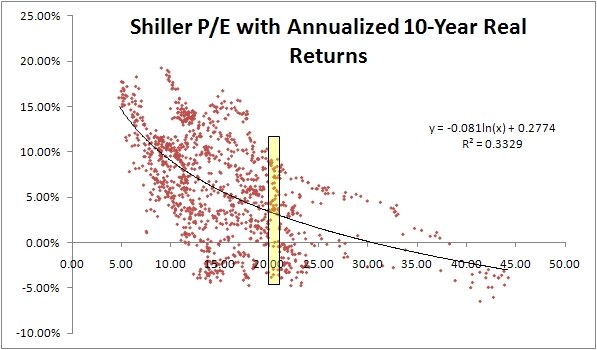
"Ten-year forward average returns fall nearly monotonically as starting Shiller P/E’s increase. Also, as starting Shiller P/E’s go up, worst cases get worse and best cases get weaker (best cases remain OK from any decile, so there is generally hope even if it should not triumph over experience!)."
"If today’s Shiller P/E is 22.2, and your long-term plan calls for a 10% nominal (or with today’s inflation about 7-8% real) return on the stock market, you are basically rooting for the absolute best case in history to playout again, and rooting for something drastically above the average case from these valuations."
"So why do some people dismiss today’s high Shiller P/E, saying it’s not a problem?... They point out that we had two serious earnings recessions recently (though only the tail end of the 2000-2002 event makes it into today’s Shiller P/E), including one that was a doozy following the 2008 financial crisis. They thus feel the final (the right end of the graph) strong earnings number is more relevant than that of the prior 10 years."
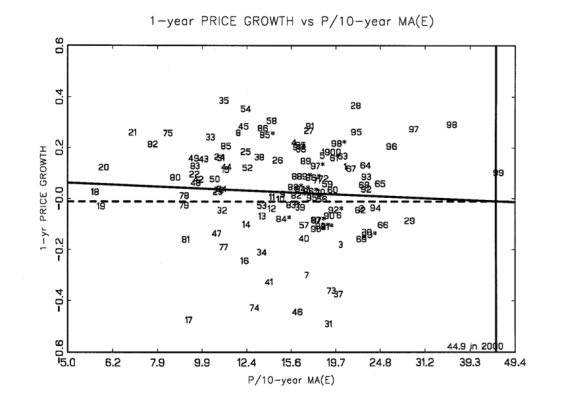
"Not surprisingly, if one compares one-year earnings to history, things look much rosier, though the stock market is still not cheap. Instead of a Shiller P/E that is in the 80th percentile versus history right now (expensive), the one-year P/E is in the 54th percentile since 1926 (trivially expensive)"
The last quote is one I think is critical -- basically a 60/40 portfolio can expect a real return of just 2.2%:
"To get the expected real return on stocks you invert the Shiller P/E to get an earnings yield. For bonds we compare 10- year nominal yields on Treasury Bonds to forecasted long-term inflation (here we use nothing fancier than trailing three- year inflation). Take 60% of the stock market number and 40% of the bond market number and you get the above graph, an estimate of the expected long-term forward looking real return on the whole 60/40 portfolio. Needless to say it’s now very low versus history (2.2% real as of September 30, 2012)."
I don't think so...