Latest Inflation Numbers and Discussion

Attachments

  • IMG_2140.jpeg
    IMG_2140.jpeg
    204.3 KB · Views: 4
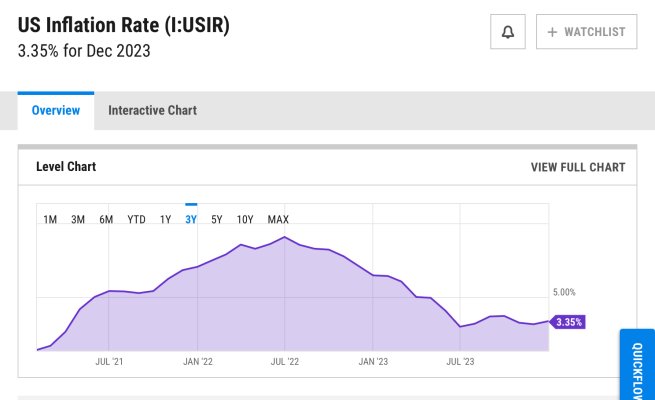
Yes, but looking at that 3 year view inflation looks to be stubbornly stuck above 3% since July 2023.
The first 6% inflation reduction was easy, the next 1% will be harder. But I think the trend is in the right direction and I predict we will be close to 2% by the end of this year, maybe as soon as July.

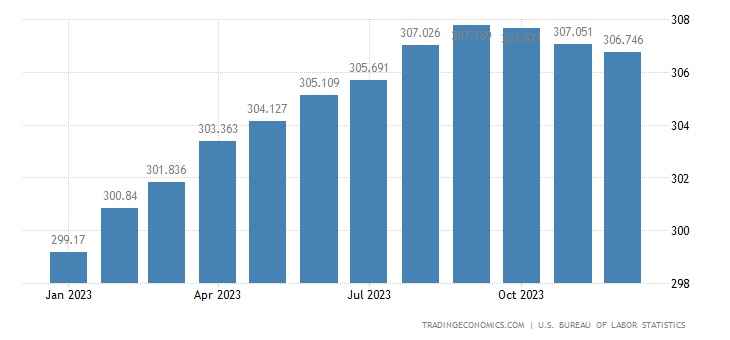
Here is another graph of actual CPI to help visualize the trend.
 

Attachments

  • united-states-consumer-price-index-cpi as of Dec 23.png
    united-states-consumer-price-index-cpi as of Dec 23.png
    16.8 KB · Views: 9
Last edited:
It’s hard to imagine a period of prices falling for more than a few months. I can see it happening for a quarter, maybe six months to formerly highly inflated prices as the costs that drove them up go down, and Economic Man starts to buy less, switches to substitutes, and decides to go without.


The other day I notice an interesting jar of vegetable dip. But, $5 for that small jar of dip? No. The store can keep their dip. Maybe I will get it on the clearance aisle in a few months for $1.99.

But do the inflation measures account for consumers doing without or shifting to substitute products or waiting for clearance? I suspect not and am not sure how it possibly could.
 
It’s hard to imagine a period of prices falling for more than a few months. I can see it happening for a quarter, maybe six months to formerly highly inflated prices as the costs that drove them up go down, and Economic Man starts to buy less, switches to substitutes, and decides to go without. ......


Housing cost is the largest component of the CPI and it is known to be a lagging indicator. So it tends to drive the trend (up or down) longer than you would expect.
See https://www.cato.org/commentary/we-...ng inflation tends to lag,the next year or so.
 
Last edited:
But 3% would be near to historical norms. The Fed's 2% target is ambitious compared to historical norms.

Yes, but I’m talking about as compared to deflation over a 12 month period.

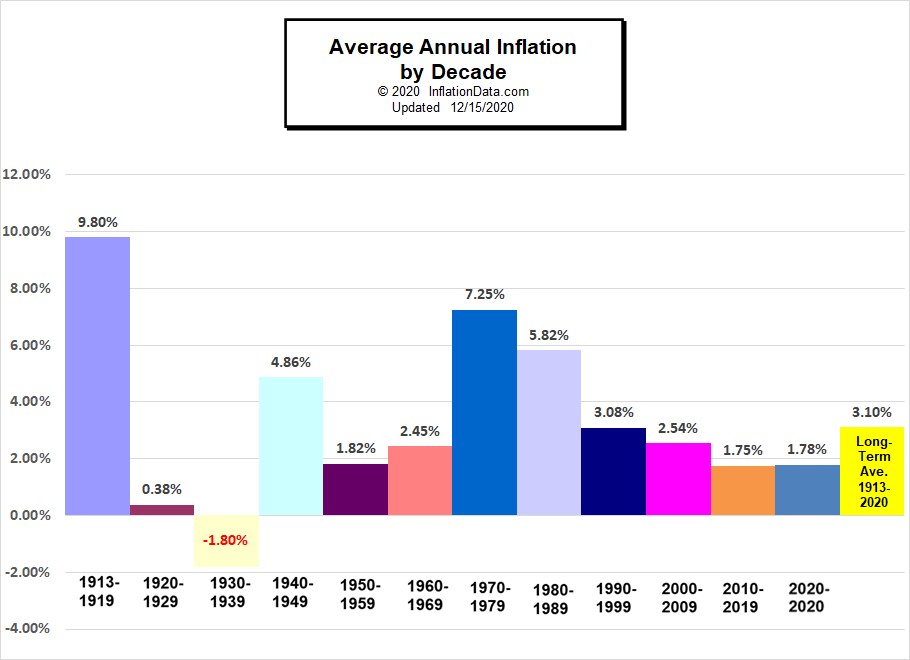
Although our fairly recent history 2010-2020 annual inflation was under 2%. And 2000-2009 averaged 2.54%.

Ave-%20Ann-Inf-by-Decade2020.png
 
Last edited:
There is no mention of 2026 that I can find. It says updated Dec 12, 2023.

OK - I see some discussion from today in the comments, thanks.

It is helpful to compare his explanation about the rate adjustment mechanism with the CPI chart I posted. While it's theoretically possible for IRMAA brackets to fall, it is unlikely without a much higher amount of deflation between now and August.
 
But does it include the "haven't seen" price increases for the new UAW and UPS labor contracts? I can't imagine the Big Three and UPS eating those increases.
 
Yes, I’m talking about as compared to deflation over a 12 month period.

Although our fairly recent history 2010-2020 annual inflation was under 2%. And 2000-2009 averaged 2.54%.

Ave-%20Ann-Inf-by-Decade2020.png

Nice graph. I just hope that we don't return to the war on savers from 2010-2020 that resulted in historically low inflation and made bond yields a joke. 3% inflation/5% bond yields would be about right and good for the economy.
 
But 3% would be near to historical norms. The Fed's 2% target is ambitious compared to historical norms.
This year's 3.4% is higher than all but one year prior to the 2020 Covid induced inflation over the last 30 years.
40 of the last 110 years have been under 2% inflation. 22 of the 110 were over 5%, so that 20% of the time the inflation rate is more than twice the target of the Federal Reserve, Kind of like filling a 20 gallon fish tank with 40 gallons of water, they have a little bit of spillage in their operation, it is not a controlled system.
 
Nice graph. I just hope that we don't return to the war on savers from 2010-2020 that resulted in historically low inflation and made bond yields a joke. 3% inflation/5% bond yields would be about right and good for the economy.

Well, there is a decent chance that rates go quite low for a while. It may be needed to get the economy going or to keep it going. It is more of a war on unemployment than a war on savers.

And of course this is the profound risk of an all debt portfolio. Interest rates ratchet down and slowly it becomes untenable.

Now, a hard recession might provide a new entry point. That could be something.

And there are plenty of reasonably prices stocks out there, perhaps most stocks. But indexers cannot participate in that.
 
But does it include the "haven't seen" price increases for the new UAW and UPS labor contracts? I can't imagine the Big Three and UPS eating those increases.

New vehicles are only 4.313% of the CPI and labor costs represent about 15% of the sticker price on a new car, so that affect will be small. (assume the UAW gets a 20% raise, that will increase CPI by 0.13% or approximately 0.4 points)

UPS price hikes would affect more components of the CPI, but again, the overall effect likely will not be large because transportation wage costs are only a portion of transportation costs, and transportation costs are only a portion of the costs of final goods. I have been looking for better data on those percentages and will post if I find it.
 
My gas royalty income was reduced by 50% in 2023, in part due to lower natty gas prices and lower draw from my property (or demand).
 
Nice graph. I just hope that we don't return to the war on savers from 2010-2020 that resulted in historically low inflation and made bond yields a joke. 3% inflation/5% bond yields would be about right and good for the economy.

It was the other way around - the historically low inflation (and occasional brief periods of deflation) caused interest rates to be so low, as well as the 2008 financial crisis and Great Recession, etc.
 
My gas royalty income was reduced by 50% in 2023, in part due to lower natty gas prices and lower draw from my property (or demand).

Mine too. I don't actually own gas producing property, just shares in a natural gas royalty trust (SJT).
 
Nice graph. I just hope that we don't return to the war on savers from 2010-2020 that resulted in historically low inflation and made bond yields a joke. 3% inflation/5% bond yields would be about right and good for the economy.

It was the other way around - the historically low inflation (and occasional brief periods of deflation) caused interest rates to be so low, as well as the 2008 financial crisis and Great Recession, etc.

No, it wasn't the other way around. We said the same thing.

I said "historically low inflation ... made bond yields a joke". Isn't that the same as saying that "historically low inflation... caused interest rates to be so low"?
 
Housing and Shelter Going Lower

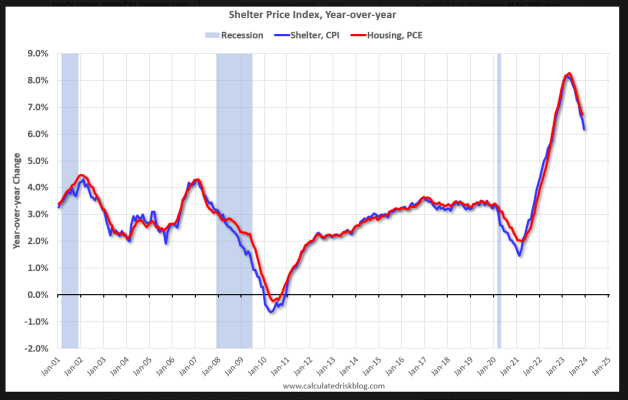
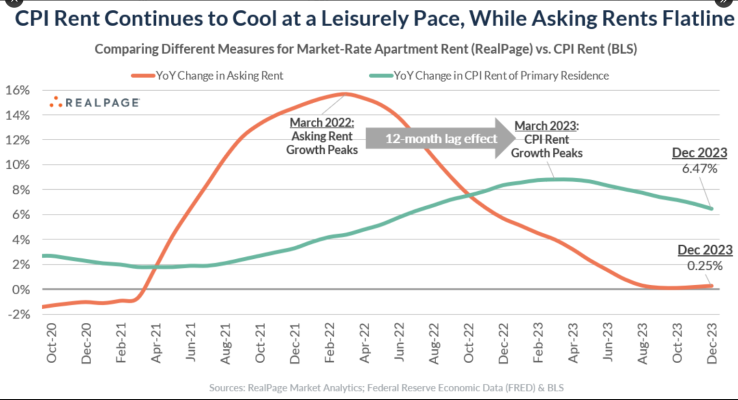
I think Gumby's assessment of inflation is spot on. Housing composes approximately 1/3 of the CPI. Housing costs, as measured in the CPI, have been dropping quite consistently in the past few months, due in large part to the huge volume of multifamily housing entering the US market.

Bill McBride, at his Calculated Risk Blog, does a great job tracking housing and creating very useful graphs. Bill's latest for shelter from today's CPI release is the first attached graphic.

In the same post, Bill notes: Moody's just reported that effective rents were down YoY: "At the national level, asking rent was down to $1,825 while effective rent closed at $1,732, 0.8% and 1.7% lower than their respective year-ago levels."

Pretty clear that the the shelter component of CPI is going to further drive the headline CPI # below current levels, likely into the 2% range.

Another analyst, Jay Parsons, makes the same argument while going into more detail of how the housing component of CPI works:


A screen shot from Jay's Twitter post is the second attached graphic.
 

Attachments

  • Shelter Price Index.PNG
    Shelter Price Index.PNG
    123.2 KB · Views: 2
  • Jay Parsons Rent Graph.PNG
    Jay Parsons Rent Graph.PNG
    238.8 KB · Views: 3
No, it wasn't the other way around. We said the same thing.

I said "historically low inflation ... made bond yields a joke". Isn't that the same as saying that "historically low inflation... caused interest rates to be so low"?

You said:
I just hope that we don't return to the war on savers from 2010-2020 that resulted in historically low inflation …..
Your comment implied to me that very low Fed funds rates (i.e. war on savers) caused the historically low inflation.
 
Back
Top Bottom