Reversion to Mean

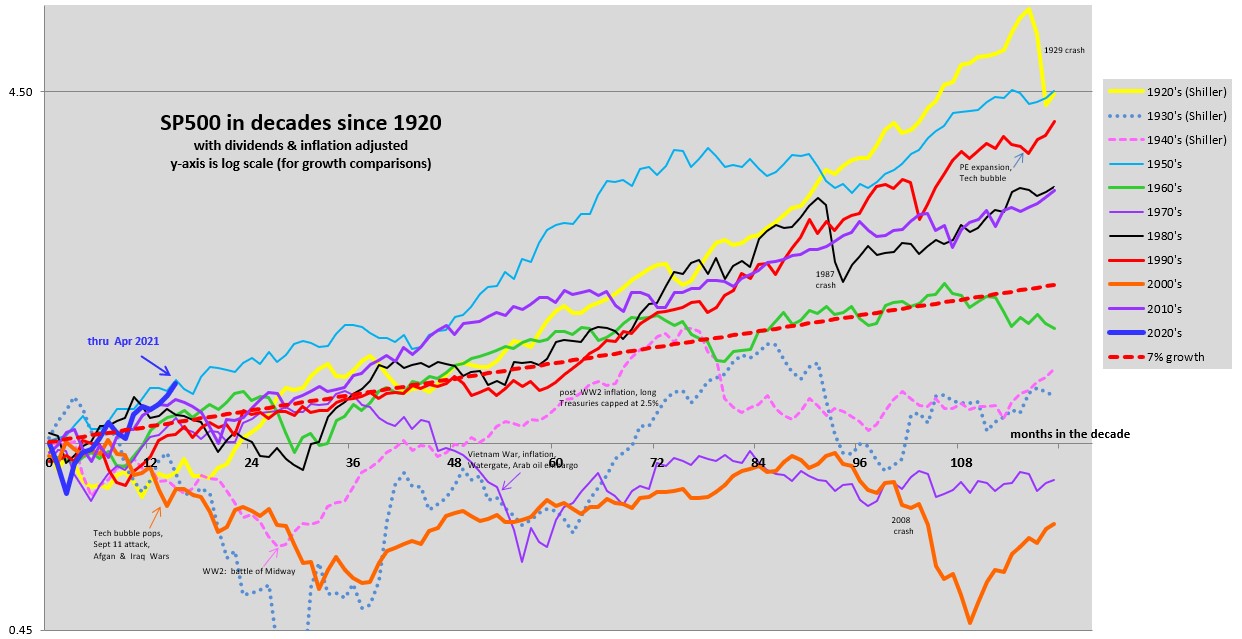
The late Bogle talked about P/E reversion, and used it to set his forecast. However, he used that to temper people's expectations, and never claimed he knew when that P/E reversion would happen or how it would happen. It may happen in a hurry, or spread out over many years. Hence, he stressed that his forecast of future returns was for long periods of a decade or more, not for next year.

Absolutely. There's no timeframe implied in his equation, but if you believe it, then today's outsized returns predict future below-average returns. That's all mean-reversion suggests.
 
Absolutely. There's no timeframe implied in his equation, but if you believe it, then today's outsized returns predict future below-average returns. That's all mean-reversion suggests.

The problem is that whenever stocks go down, some immediately claim that it is the herald of "mean reversion".

And then, stocks go back up. :)

Nah, it will take longer than a few days to play out, this "mean reversion" thing.

Meanwhile, I will keep on betting against short-term fluctuations, which are often ridiculous and driven by greed/fear and not fundamentals.
 
The problem is that whenever stocks go down, some immediately claim that it is the herald of "mean reversion".

And then, stocks go back up. :)

Nah, it will take longer than a few days to play out, this "mean reversion" thing.

Yeah, I guess it has some "market timing" implications to some people, which may be why it's not a very popular concept.

Hussman is one of the biggest believers, and he's been waiting a *long* time for it to happen. Fighting the fed. Oops.
 
The problem is that whenever stocks go down, some immediately claim that it is the herald of "mean reversion".

And then, stocks go back up. :)

Nah, it will take longer than a few days to play out, this "mean reversion" thing.

Meanwhile, I will keep on betting against short-term fluctuations, which are often ridiculous and driven by greed/fear and not fundamentals.

I notice that mean reversion seems to be applied mostly to decline ideas. In other words, it is something people trot out when they are feeling negative. I don't really think mean reversion is a good timing mechanism unless you have a good analytical framework which I have not seen ... yet.
 
Yeah, I guess it has some "market timing" implications to some people, which may be why it's not a very popular concept.

Hussman is one of the biggest believers, and he's been waiting a *long* time for it to happen. Fighting the fed. Oops.

I seem to recall Hussman was very negative after the 2009 decline. He became a broken clock. His funds suffered for years. Haven't checked on his performance for years.
 
I seem to recall Hussman was very negative after the 2009 decline. He became a broken clock. His funds suffered for years. Haven't checked on his performance for years.

I like him as an example because he's a lot smarter than me, he created a back-tested model with lots of fundamental insights, and he's been crushed.

He finally capitulated a few years ago (he says 2017) and he now weighs market action a lot more than he used to. But it looks like he's still underperforming the S&P500.
 
Everybody knows that the P/E has been running above the historical average, and it may "revert to the mean".

Yabut the P/E is related to the interest rate, and the interest rate ain't at its mean either. It's near 0, for crying out loud. Is it going to be stuck there, or even going negative?

Or is it going up, like the Fed said last week? And they are talking about 2023. That's 2 years from now. The market immediately sold off. Oh my god, mean reversion is here. :facepalm:

Sell everything! Which is what they did on Friday.

Today, somebody is buying nearly everything. Is it the same people who sold Friday? I don't care, as long as somebody is buying.

The put options that made me buy some stocks on Friday, that was a nice thing. I am already in the green with those. Just sold call options on them to perhaps lower my stock AA a bit. Heh heh heh...


PS. Don't get me wrong. The downpour of last week got me wet. Overall, I lost money. But the cup I stuck out to catch some of the drops now contains some fresh water to drink. It's better than nothing. ;)
 
Last edited:
This is what makes ER so fun. If mean reversion happens after I'm dead, I don't care.

If somebody ER's today, and P/E mean-reverts over the next decade, that could suck.
 
This is what makes ER so fun. If mean reversion happens after I'm dead, I don't care.

If somebody ER's today, and P/E mean-reverts over the next decade, that could suck.

They still would not have to eat cat food, if they keep their WR low. How low? We have had countless threads about that.
 
You realize the next lines are;

You got no money, you got no home

Spinning Wheel all alone

Talkin' 'bout your troubles and you

You never learn
It means,

What goes up must come down
Spinnin' wheel got to go 'round
Talkin' 'bout your troubles it's a cryin' sin
Ride a painted pony let the spinnin' wheel spin
 
You realize the next lines are;

You got no money, you got no home

Spinning Wheel all alone

Talkin' 'bout your troubles and you

You never learn

Beat me to the post.:LOL:
 
Where's the one-armed forecaster when you need them?

Nobody talks about reversion to the mean when it's in the depths of a crash? Oh, maybe they do. Same principle. I changed my AA based on the long PE being high. I was "wrong", but I'm not changing the AA back until I'm right, which may never happen :)
 
Nobody talks about reversion to the mean when it's in the depths of a crash? Oh, maybe they do.

I don't know if they talk about it, but I personally got very excited by 2008-2009. I went in a bit early, but I was definitely a buyer.
 
Note that the straight-line fit is on a log chart, hence it's an exponential regression, and not a linear regression.
Right. That's because steady growth, e.g. X% per year, is exponential. X% per year on a linear chart is an exponential curve; X% per year on a log chart is a straight line. The slope of that line (on the log chart) tells you the growth rate. A log chart shows the same data as a linear chart, it just shows it more clearly if you're looking at exponential growth.

People generally claim the market has historically grown about 8-10% per year. That's **BEFORE** inflation. @donheff's chart is inflation-adjusted, and it shows 1.9%/yr AFTER inflation. And actually by my measurement, the AFTER-inflation growth was only about 5.8%, going back to 1897. It's about 7.8% per year going back to 1932, and you might increase that 7.8% a bit with dividends. But it's cheating a bit to measure from the "Great Depression bottom" to the "all-time high" and call that the average.

Sometimes it goes berserk like it has recently, about 16.3% per year (before inflation) since 2009. Does that mean the market's not growing at 8%/yr any more? No, it means we haven't had a bear market in a while, and it's gotten well above its typical historic growth rate. And historically crashes happen now and then. Sooner or later the market will take a big dump, "reverting to the mean," and we'll be back around 8%/yr. "Reversion to the mean" basically just mean the market gets overstretched -- bought unsustainably high like in 1929 (or arguably, like it is now), or panic-crashed overly low like it did in 2009 or 1932 -- and eventually it generally snaps back.

A coin toss is a random walk. Each coin toss is independent of the past tosses.

Market movement is not a true random walk. ... The coin does not have memory. People have memory.
Exactly right. They theorize that's why markets trend, or why it shows levels of "support" and "resistance."
 

Attachments

  • DJIAgrowth.gif
    DJIAgrowth.gif
    27.6 KB · Views: 15
Last edited:
Right. That's because steady growth, e.g. X% per year, is exponential. X% per year on a linear chart is an exponential curve; X% per year on a log chart is a straight line. A log chart shows the same data, it just shows it more clearly if you're looking at exponential growth.

The market has historically grown about 8% per year. Sometimes it goes berserk like it has recently, about 16.3% per year since 2009. Does that mean the market's not growing at 8%/yr any more? No, it means it's gotten well above its typical historic growth rate. And historically crashes happen now and then. Sooner or later the market will take a big dump, "reverting to the mean," and we'll be back around 8%/yr.
...

I think you have to go back further (see red font) then 2009 since that was the end of a very bad cycle which includes the 2001 recession and the terrible market in 2008-2009 (ended Feb 2009).

Here is the chart I post occasionally. For this discussion you would have to look at the orange line (2000's), the purple line (2010's), and the current thick blue line (2020's).

image1.jpg


The chart is not predictive of what will come next. Just one way of looking at old stock market history.
 
Market movement is not a true random walk. After a long string of gains, people are edgy and want to book profits. Conversely, after a large decline, more people are willing to bid the price back up. The coin does not have memory. People have memory.

Exactly right. They theorize that's why markets trend, or why it shows levels of "support" and "resistance."

I forgot to add that while people have memory, some have theirs too short. :D

After a long bull market, they forget the pain of previous crashes. Buy, buy, buy...

And then, after a crash, some people remember the recent pain but not the previous gain, sell and never buy back in again.
 
Last edited:
when referring to corporate bonds the mean value is all ways $1000/bond...
so with FED interest rates so low and many bonds at this moment selling for over $1500/bond then they have a ways to drop back to the "mean" value... I saw a article by the FED the other day that was telling about a 55% slide in value and a 5% spread between corporate vs treasury is possible....
 
Back
Top Bottom