marko
Give me a museum and I'll fill it. (Picasso) Give me a forum ...
- Joined
- Mar 16, 2011
- Messages
- 8,462
Right up front: I'm far from a math wiz.
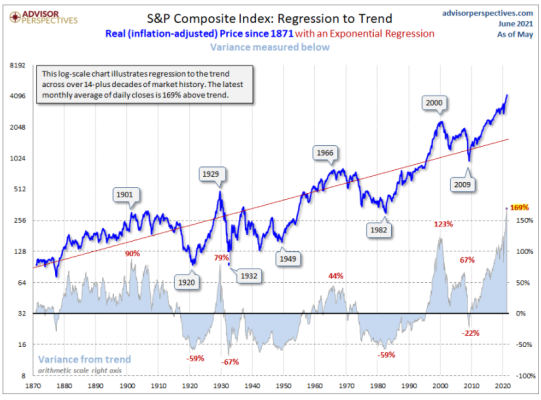
I keep reading about stocks "reverting to mean".
Yes, I'm not such a dope that I don't know what 'mean' means, but I'm wondering how the mean is defined.
It is a 3 year, 5 year, 10 year average? Over time a stock's mean should/could change considering the wild market swings over the past 15 years; I'd assume 2008 and 2020 would figure into a long term average to some extent.
Companies change their positions in the market over time as well (ex: GE), so how is the mean arrived at?
Per usual, I could be entirely in the weeds here so apologies in advance if so.
")