Stock Picking (Beat Boho) Contest - V2.0

Below is from M* for 3/29/17 to 10/31/19.

S&P 500 (VFIAX): $1,354,221... 12.41% annualized return
Total Stock Market (VTSMX): $1,335,594... 11.81% annualized return
Boho II: $1,329,442... 11.61% annualized return

That's me being .2% behind VTSMX, right? I know that's not the benchmark some of us are using but it's a total stock market fund. It's the kind of fund I'm comparing myself with. I know I'm further behind some other funds.
 
... so, I'm .167% away from a total stock market investor, with a previous agreement that "0.1% difference is flat" making me essentially .067% behind.

Wait...the MoE is .33% annualized, so I'm within the MoE already.

No one agreed with that silliness except some guy named Boho, or was it Boho II?

Behind is behind, there is no 'flatness' or 'margin of error'. Try writing a check for $100 with $99 in your account, and explain to the bank you were within the 'margin of error'.

I have to wonder (well, not really), if your margin of error, or 'flatness' would apply if you were ahead? Would you say you weren't really ahead? Hah!

-ERD50
 
That's me being .2% behind VTSMX, right? I know that's not the benchmark some of us are using but it's a total stock market fund. It's the kind of fund I'm comparing myself with. I know I'm further behind some other funds.

No one agreed with that silliness except some guy named Boho, or was it Boho II?...

+1 I call bullsh!t too.... Bozo has consistently used the S&P 500 aka SPY as his benchmark.... not that the S&P 500 is spanking him he wants to change it to Total Stock so he is only getting beat but not spanked.

The man knows no shame.

....If we compare me with one thing it should be the S&P 500
 
Last edited:
No one agreed with that silliness except some guy named Boho, or was it Boho II?

+1 I call bullsh!t too....
First, I agree with the author that 0.1% difference is flat.

But..... you're only 1 1/2 years/6 quarters into the contest.... so even under your definition of flat you should only be behind by 0.6% (6 quarters * 0.1%/quarter).

Bozo has consistently used the S&P 500 aka SPY as his benchmark.... not that the S&P 500 is spanking him he wants to change it to Total Stock so he is only getting beat but not spanked.

The man knows no shame.

I don't want to change anything. I said months ago that I want to use both. But as you just quoted, if we're just using one it should be the S&P 500.
 
Last edited:
One of the things I try to do is avoid well known stocks, but I made an exception and bought Delta (DAL) for $56.58. I already forgot why.
 
Boho: $1,366,457.14

I'm estimating that's a dead heat with nunnun, about .2% per year behind the S&P, and ahead of a "total stock market" fund.

I can't get today's graph from Morningstar yet and I still can't find ERD50's equation for Yahoo's adjusted close.
 
Boho: $1,366,457.14

I'm estimating that's a dead heat with nunnun, about .2% per year behind the S&P, and ahead of a "total stock market" fund.

I can't get today's graph from Morningstar yet and I still can't find ERD50's equation for Yahoo's adjusted close.

How 'bout we stick to EOM updates. I don't feel like running the numbers on any given day that you think you may have advanced. Did nunnun ask for an update every time the market rocked?

And it's not "my equation". It's 5th grade arithmetic. Were you playing Rock-Paper-Scissors instead of paying attention in class that day? Here's a refresher - but your spreadsheet will do most of the work for you:


See you Nov 29th.

-ERD50
 
I wouldn't even know what fractions to multiply. You're not a good teacher.
 
Actually, my comparison with the S&P 500 was just .2%/year away from pb4uski's, while Fidelity's numbers were .33%/year away from M*'s, so I guess I'm close enough.
 
I wouldn't even know what fractions to multiply. You're not a good teacher.

I might be an excellent teacher, but I have no interest in taking the time to teach you how to apply basic arithmetic to a "story problem". I'd rather tutor some 5th graders.

-ERD50
 
I might be an excellent teacher, but I have no interest in taking the time to teach you how to apply basic arithmetic to a "story problem". I'd rather tutor some 5th graders.

-ERD50

You might have noticed that I applied basic arithmetic to a story problem multiple times in my own comparison with the S&P 500. I was told I was over complicating it. I'm starting to believe I should have been praised for simulating the rules of the game, in which you can't buy fractional shares. I think part of the reason my numbers are different is because the Yahoo! method you use and the method M* uses for its graphs assumes fractional shares can be bought. In an up market, that favors the indexer.
 
Boho Vs. S&P 500
Boho: $1,366,457.14
VFIAX (S&P 500): $1,370,870
$1,370,870 - $1,366,457.14 = $4412.86
$1697 per year (Boho is .32% per year behind S&P 500)

Boho Vs. Total Stock Market
Boho: $1,366,457.14
VTSMX (Total Stock Market ): $1,349,585
$1,366,457.14 - $1,349,585 = $16,872.14
$6489 per year (Boho is 0.47% per year ahead of VTSMX)

Boho would be .18% per year ahead of nunnun.

I think

And this is by Morningstar, with the indexer allowed buy fractional shares with cash while I can't.
 
Last edited:
Boho Vs. S&P 500
Boho: $1,366,457.14
VFIAX (S&P 500): $1,370,870
$1,370,870 - $1,366,457.14 = $4412.86
$1697 per year (Boho is .32% per year behind S&P 500)

Boho Vs. Total Stock Market
Boho: $1,366,457.14
VTSMX (Total Stock Market ): $1,349,585
$1,366,457.14 - $1,349,585 = $16,872.14
$6489 per year (Boho is 0.47% per year ahead of VTSMX)

Boho would be .18% per year ahead of nunnun.

I think

And this is by Morningstar, with the indexer allowed buy fractional shares with cash while I can't.

"I think"? Why in the world do you think this? I can't even figure out what mistake you made to come up with those numbers. Do you use some sort of "Rock-Paper-Scissors" calculator?

Rather than worry about the minutia of small %/year deltas, "flatness", or "Margin of Error", or fractional shares not invested (which would hurt in an up market, but help in a down market anyhow), just show some actual strategy and stock picking/timing skills (not a Win/Loss ratio), and show a clear lead so the detail of these calculations won't matter.

For the record, nunnun was invested 50/50 in VOO/VTI.

How 'bout we stick to EOM updates. ....

See you Nov 29th.

-ERD50

See above - ERD50

See above again.

-ERD50
 
"I think"? Why in the world do you think this? I can't even figure out what mistake you made to come up with those numbers. Do you use some sort of "Rock-Paper-Scissors" calculator?

VFIAX: $1,370,870 was on top of the M* graph for the date range 3/29/17 to 11/5/19. I've previously spelled out how I get the monthly and annualized amounts from that and nobody corrected me. This time I think I estimated that 31.2 months had passed, so I divided by that and multiplied by 12 for the annualized figure. I used a percentage calculator for the percentages. I averaged the percentages by adding them (I made the negative one negative unlike in my post) and dividing by two, which I wasn't totally sure about. I'm not totally sure about any percentages actually, but nobody corrected me in the past.
 
Last edited:
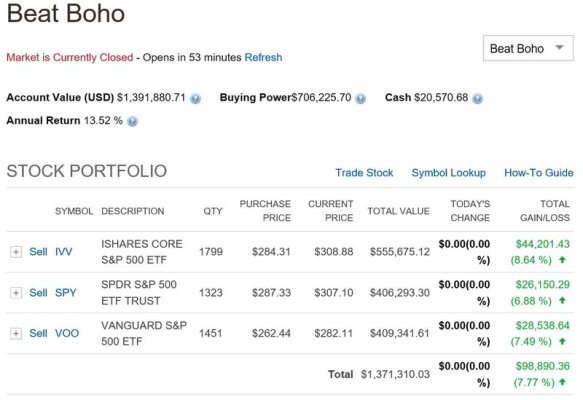
I don't know what I'll do for the rest of the contest. I could trade with my $20,570.68 cash with no chance of losing to the index just to say I'm still playing or I could keep playing as I've been playing, or I could get daring and go for #1, or make like nunnun and nap.

Current RankPrevious day's rankAccount Value (USD)Today's change in valueOverall%
1. comsecga1$3,241,222.81$8,288.40224.12%
2. Spudd2$2,775,728.87($3,741.00)177.57%
3. kite_rider3$2,265,401.66$35,455.00126.54%
4. cfahey274$1,447,115.17($4,633.50)44.71%
5. BohoII5$1,391,880.71$25,423.5739.19%
6. wmc10006$1,291,974.38$7,060.1829.20%
7. lbymfreddie7$1,275,716.48($1,003.90)27.57%
8. DieWurst8$1,236,303.99($1,769.44)23.63%
9. wrd589$1,214,946.14$512.0021.49%
10. nvestysly11$1,192,982.93$3,688.1919.30%
11. easysurfer12$1,150,751.01($147.54)15.08%
12. covert110$1,146,894.74($63,255.00)14.69%
13. KCScubaSteve13$1,099,108.45$5,751.469.91%
14. RiskyBusinessC214$1,025,278.22($5,400.00)2.53%
15. ransil15$1,005,184.88($2,383.20)0.52%
16. guestperson16$1,001,430.01$445.000.14%
17. dixonge17$1,000,000.00$0.000.00%
18. exnavynuke18$1,000,000.00$0.000.00%
19. jmil0719$1,000,000.00$0.000.00%
20. consvgmbl20$1,000,000.00$0.000.00%
21. monitorLizzy21$1,000,000.00$0.000.00%
22. secondcor52122$1,000,000.00$0.000.00%
23. natetheb23$970,248.95$362.38-2.98%
24. sengsational24$929,545.75($7,548.85)-7.05%
25. lawrencewendall25$787,876.28$261.91-21.21%
 

Attachments

  • contest.jpg
    contest.jpg
    63.8 KB · Views: 15
Regardless of Boho's creative arithmetic, you have to admit he's still kind of entertaining.

 
How do I determine when trading was halted and resumed for ALNY?

I heard from unofficial sources that trading for ALNY was halted at 11:47 AM EST and resumed at 3:30 PM EST

Investopedia let me buy 6000 shares of ALNY at $105.27 at 2:56PM EST.
 
Last edited:
Investopedia let me buy 6000 shares of ALNY at $105.27 at 2:56PM EST.

I just sold it at $108.88. I'm glad I beat the S&P 500 legitimately when I did, and that I documented it. Although ALNY didn't seem to shoot up immediately when trading resumed so maybe I'd have had a chance to legitimately buy.
 
Last edited:

I like the treading water part: "At some point the market will work off its overbought nature. Whether it’s by treading water for a time or correcting remains to be seen."

You don't hear that much. It's usually expected that there will be a correction at some point when the market is overbought and the discussion is usually about when.

But then the article tries to sell me stuff...
 
November

Current RankPrevious day's rankAccount Value (USD)Today's change in valueOverall%
1. comsecga1$3,508,867.02($22,434.40)250.89%
2. Spudd2$2,913,354.10($11,779.00)191.34%
3. kite_rider3$2,325,311.66$68,175.00132.53%
4. cfahey274$1,489,492.67($6,734.00)48.95%
5. BohoII5$1,440,046.08($5,029.33)44.00%
6. wmc10006$1,259,964.49($3,685.36)26.00%
7. lbymfreddie7$1,259,641.80$2,663.4225.96%
8. DieWurst8$1,236,014.35($14,303.88)23.60%
9. wrd589$1,220,447.14($8,479.00)22.04%
10. nvestysly10$1,207,614.76($5,750.12)20.76%
11. easysurfer11$1,162,715.31($4,356.96)16.27%
12. covert112$1,120,804.74$17,135.0012.08%
13. RiskyBusinessC213$1,010,278.22($1,800.00)1.03%
14. ransil14$1,005,326.26($2,286.00)0.53%
15. dixonge15$1,000,000.00$0.000.00%
16. exnavynuke16$1,000,000.00$0.000.00%
17. jmil0717$1,000,000.00$0.000.00%
18. consvgmbl18$1,000,000.00$0.000.00%
19. monitorLizzy19$1,000,000.00$0.000.00%
20. secondcor52120$1,000,000.00$0.000.00%
21. guestperson21$999,265.01$340.00-0.07%
22. natetheb22$974,766.35($6.37)-2.52%
23. sengsational23$942,087.85($7,061.10)-5.79%
24. lawrencewendall24$795,129.76$490.93-20.49%
 
November
...

Well, my, my. In the first time since I've been tracking this, Boho has gone positive relative to a do-nothing Buy & Hold VTI/VOO market sleeper.

That's one time, over the past 25 months. Two years ago, Boho was negative to the tune of $157,117. He fell further to -$198,267 in Dec 2018, and has been more than $100,000 in the red for 15 of those 25 months.

Stunning! :)

-ERD50
 
Still, it ain't over 'til it's over. Boho could end up the winner, but I think it's unlikely that the time and effort cost will be worth the difference, unless he hits a multi-homer just before the contest ends.
 
Still, it ain't over 'til it's over. Boho could end up the winner, ....

Sure, I've said that from the start. A dart throwing monkey has about a 50/50 chance of beating the market. Which is what the contest has mostly turned into, since a lot of people dropped out, or were dropped out due to some anomalies.

He could hit a grand slam yet, or strike out.

Are the top 4 still active? The top 3 are way ahead, very unlikely that Boho can catch them. Did one of them tell us their account got hosed up, but in their favor?

-ERD50
 
Back
Top Bottom