Boho
Thinks s/he gets paid by the post
- Joined
- Feb 7, 2017
- Messages
- 1,844
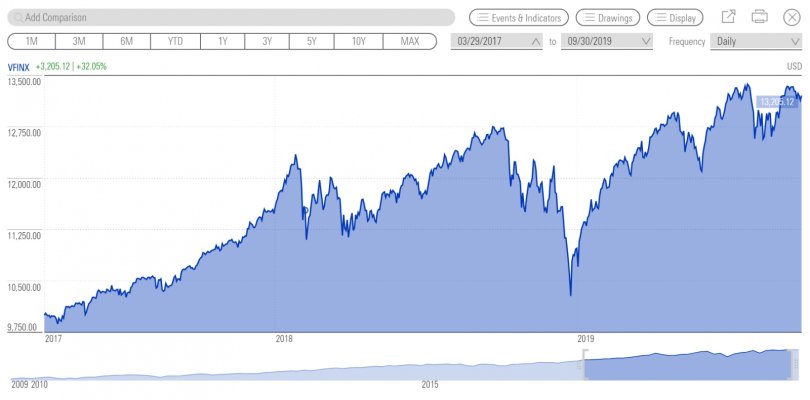
Earlier I saw two articles, one emphasizing that there's a significant difference between total market funds and S&P 500 funds and the other saying a .74% quarterly return difference (8.8% over three years) isn't significant. I chose not to post them but I will say that annual percent difference compared with the S&P 500 is what most people would care about. Last I checked that difference was under 1% and I gained in the thousands more than the S&P since then.