 |
|
02-26-2021, 11:00 AM
|
#1
|
Thinks s/he gets paid by the post
Join Date: Jun 2006
Posts: 1,675
|
Valuation Metrics
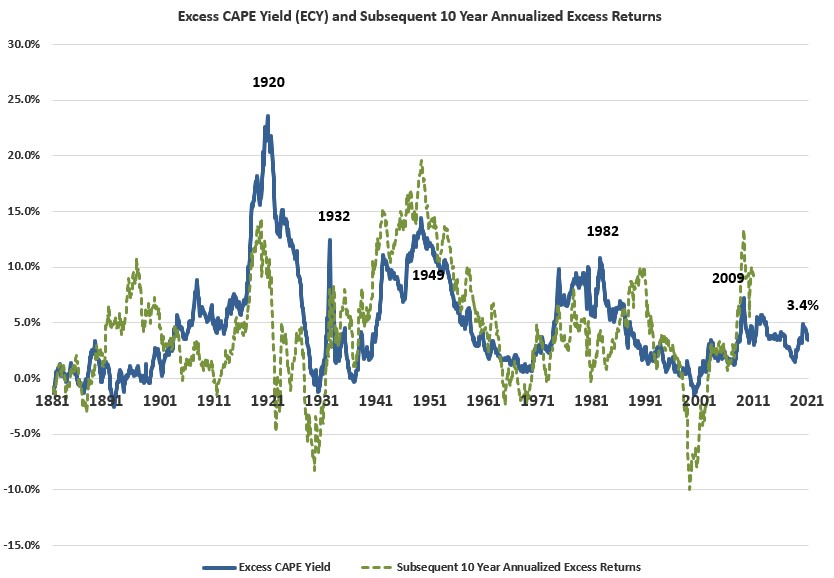
Honestly, it's been years since I paid much attention to valuation metrics, but it seems like a good time to take a peek at a few.
Got any favorites?
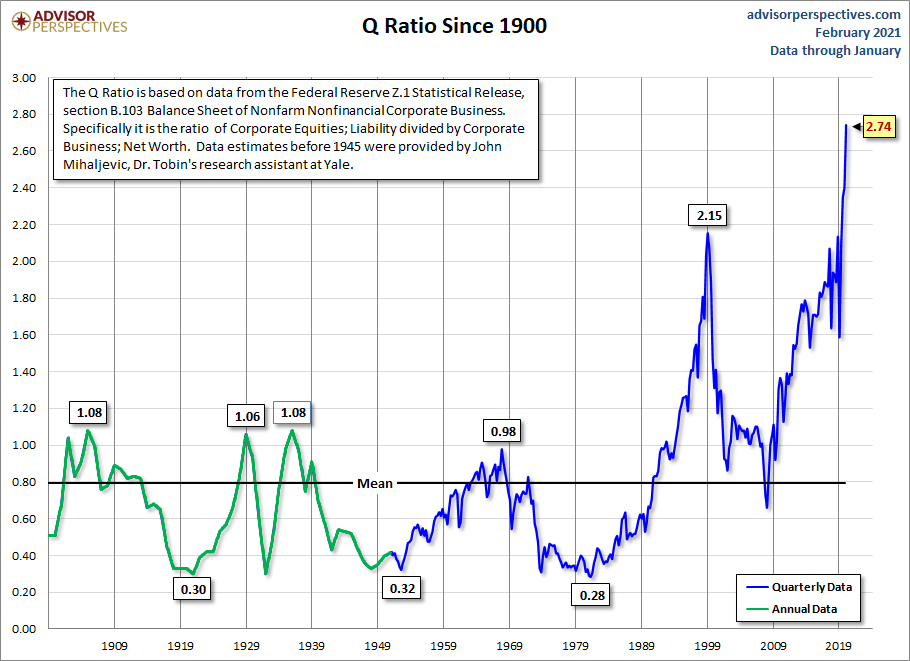
Everybody loves Tobin's Q, right? Just checked, and it's indicating the market is a bit overvalued. OK, way overvalued. The most overvalued ever.
What do I do with this info? Nothing actionable. I use it to set expectations of magnitude of a correction if/when we get one.
|
|
|
 |
Join the #1 Early Retirement and Financial Independence Forum Today - It's Totally Free!
Are you planning to be financially independent as early as possible so you can live life on your own terms? Discuss successful investing strategies, asset allocation models, tax strategies and other related topics in our online forum community. Our members range from young folks just starting their journey to financial independence, military retirees and even multimillionaires. No matter where you fit in you'll find that Early-Retirement.org is a great community to join. Best of all it's totally FREE!
You are currently viewing our boards as a guest so you have limited access to our community. Please take the time to register and you will gain a lot of great new features including; the ability to participate in discussions, network with our members, see fewer ads, upload photographs, create a retirement blog, send private messages and so much, much more!
|
02-26-2021, 11:08 AM
|
#2
|
Thinks s/he gets paid by the post
Join Date: Jun 2006
Posts: 1,675
|
Buffett's favorite is apparently market cap to GDP:
|
|
|
02-26-2021, 11:10 AM
|
#3
|
Thinks s/he gets paid by the post
Join Date: Jun 2006
Posts: 1,675
|
Hussman basically capitulated a couple years ago, I think. But here's his latest on expected returns.
|
|
|
03-01-2021, 05:14 PM
|
#5
|
Thinks s/he gets paid by the post
Join Date: Jun 2006
Posts: 1,675
|
Price:Sales ratio is closing in on twice what it was at the dot-com bubble peak.
__________________
Emancipated from wage-slavery since 2002
|
|
|
03-01-2021, 06:14 PM
|
#6
|
Give me a museum and I'll fill it. (Picasso) Give me a forum ...
Join Date: May 2006
Location: west coast, hi there!
Posts: 7,370
|
Quote:
Originally Posted by twaddle
|
Shiller within his Excel spreadsheet data posts another measure of valuation nowadays. This includes the current 10 year Treasury rate. Here is the chart he has included:
I think this just compares the inverted value of the PE10 (CAPE) to the current 10 year Treasury rate. So if the PE10=30 this means 3.33% compared to a 10 year Treasury of around 1.5% right today corrected by the 10 year earnings. Or some such formula. Perhaps Shiller is hedging a bit to account for the extremely low rates?
Anyway according to this we are not at extremes like in 1929 or 1970 or 2000. The extremes are where I would get concerned.
|
|
|
03-01-2021, 06:17 PM
|
#7
|
Full time employment: Posting here.
Join Date: Dec 2016
Posts: 510
|
If you look at history, valuations are not such great indicators of where stocks are headed. If it were only that easy!
__________________
Retired 1/6/2017 at 50 years old
Immensely grateful
“The most important quality for an investor is temperament, not intellect.”—Warren Buffett
|
|
|
03-01-2021, 06:20 PM
|
#8
|
Thinks s/he gets paid by the post
Join Date: Jun 2006
Posts: 1,675
|
That Shiller metric is good to see. I think everybody is adjusting their models after being so wrong for so long. I see Shiller now calls this "rational exuberance."
Shiller likes international a lot more than US stocks. Me too.
The ECY is close to its highs across all regions and is at all-time highs for both the UK and Japan. The ECY for the UK is almost 10%, and around 6% for Europe and Japan. Our data for China do not go back as far, though China’s ECY is somewhat elevated, at about 5%. This indicates that, worldwide, equities are highly attractive relative to bonds right now.
__________________
Emancipated from wage-slavery since 2002
|
|
|
03-01-2021, 06:24 PM
|
#9
|
Thinks s/he gets paid by the post
Join Date: Aug 2015
Posts: 1,188
|
According to this, we are in a recession and don't even know it:
__________________
Don't do something, just stand there!
|
|
|
03-01-2021, 06:32 PM
|
#10
|
Give me a museum and I'll fill it. (Picasso) Give me a forum ...
Join Date: May 2006
Location: west coast, hi there!
Posts: 7,370
|
Quote:
Originally Posted by twaddle
That Shiller metric is good to see. I think everybody is adjusting their models after being so wrong for so long. I see Shiller now calls this "rational exuberance."
Shiller likes international a lot more than US stocks. Me too.
The ECY is close to its highs across all regions and is at all-time highs for both the UK and Japan. The ECY for the UK is almost 10%, and around 6% for Europe and Japan. Our data for China do not go back as far, though China’s ECY is somewhat elevated, at about 5%. This indicates that, worldwide, equities are highly attractive relative to bonds right now.
|
If one looks at small and midcap value stocks in the US I think the argument for international valuations is less compelling. Currently my small/midcap US stocks are beating international small stocks. But they both have been doing great especially in February so no complaints on diversifying a bit.
Both small/midcap value and international small have been out of favor as the SP500 (really the large cap growth) has been the star performer in recent years. But I am hoping this story is changing and will be generally recognized in the months to come.
|
|
|
03-01-2021, 06:44 PM
|
#11
|
Thinks s/he gets paid by the post
Join Date: Jun 2006
Posts: 1,675
|
That's a good point. Shiller's looking at the S&P500, and those cap-weighted holdings really exaggerate the valuation craziness. (TSLA!!1!!)
__________________
Emancipated from wage-slavery since 2002
|
|
|
03-02-2021, 05:48 AM
|
#12
|
Give me a museum and I'll fill it. (Picasso) Give me a forum ...
Join Date: Dec 2008
Location: Stuck in the mud somewhere in the NJ swamp
Posts: 7,048
|
When I capture month-end account values, I also fill in a column with Shiller PE10 and S&P500 data.
I thought everyone was aware of the on-going recession? The FRED Blog covers interesting data at times, and shows one how to build the graph. Here's an example:
https://fredblog.stlouisfed.org/2019...t-the-economy/
|
|
|
03-02-2021, 09:51 AM
|
#13
|
Thinks s/he gets paid by the post
Join Date: Jun 2006
Posts: 1,675
|
Here's an obscure metric: ratio of NASDAQ to NYSE volume. Not an indicator of valuation as much as tech exuberance.
__________________
Emancipated from wage-slavery since 2002
|
|
|
03-02-2021, 10:03 AM
|
#14
|
Give me a museum and I'll fill it. (Picasso) Give me a forum ...
Join Date: Jan 2006
Location: Rio Grande Valley
Posts: 28,740
|
Quote:
Originally Posted by target2019
When I capture month-end account values, I also fill in a column with Shiller PE10 and S&P500 data.
I thought everyone was aware of the on-going recession? The FRED Blog covers interesting data at times, and shows one how to build the graph. Here's an example:
https://fredblog.stlouisfed.org/2019...t-the-economy/
|
I didn’t realize FRED had a blog! Cool!
__________________
Retired since summer 1999.
|
|
|
03-04-2021, 12:02 AM
|
#15
|
Dryer sheet wannabe
Join Date: Jun 2020
Posts: 13
|
Quote:
Originally Posted by FREE866
If you look at history, valuations are not such great indicators of where stocks are headed. If it were only that easy!
|
The chart in the post just before yours seems to be a "good" (if not "great") indicator.
Other valuation metrics are reviewed in this article from Mauldin Economics (see the list of metrics credited to Doug Kass):
https://www.mauldineconomics.com/fro...e-stock-market
There's some interesting commentary, but I don't agree with all of the article's conclusions (like their opinion against 60/40 indexed portfolios).
The article also quotes Jeremy Grantham, who often has interesting things to say (even if he's criticized as being a perma-bear). Grantham once wrote that there was a shift in the equity market around 1995 or so (you can see evidence of that in the various valuation charts in this thread). My guess is that the mid-90s was around the time large market participants became convinced of the "Greenspan put" (which continues to be alive and well today, apparently), and therefore became willing to accept higher valuations than previously.
Personally, I like price-to-book and price-to-sales ratios as valuation metrics (available on multpl.com), but one has to keep in mind the mid-90s valuation shift.
Considering all of the above, I'm somewhat underweight equities at the moment.
|
|
|
03-05-2021, 05:17 AM
|
#16
|
Give me a museum and I'll fill it. (Picasso) Give me a forum ...
Join Date: Dec 2008
Location: Stuck in the mud somewhere in the NJ swamp
Posts: 7,048
|
Quote:
Originally Posted by audreyh1
I didn’t realize FRED had a blog! Cool!
|
I use the RSS feed and get a perfect copy in my email reader once or twice a week. It really is a great blog, much different than the usual tripe.
I think it may have been one of your posts in a discussion about which economic indicators to follow that led me to FRED.
|
|
|
03-05-2021, 07:14 AM
|
#17
|
Full time employment: Posting here.
Join Date: Dec 2016
Posts: 510
|
Quote:
Originally Posted by Hans
The chart in the post just before yours seems to be a "good" (if not "great") indicator.
Other valuation metrics are reviewed in this article from Mauldin Economics (see the list of metrics credited to Doug Kass):
https://www.mauldineconomics.com/fro...e-stock-market
There's some interesting commentary, but I don't agree with all of the article's conclusions (like their opinion against 60/40 indexed portfolios).
The article also quotes Jeremy Grantham, who often has interesting things to say (even if he's criticized as being a perma-bear). Grantham once wrote that there was a shift in the equity market around 1995 or so (you can see evidence of that in the various valuation charts in this thread). My guess is that the mid-90s was around the time large market participants became convinced of the "Greenspan put" (which continues to be alive and well today, apparently), and therefore became willing to accept higher valuations than previously.
Personally, I like price-to-book and price-to-sales ratios as valuation metrics (available on multpl.com), but one has to keep in mind the mid-90s valuation shift.
Considering all of the above, I'm somewhat underweight equities at the moment.
|
Couple things....
Anyone who has taken Granthams views and applied that to their investment mix has done extremely poor in the markets. Permabears always sound good, but following their advice can be financial suicide.
Shiller himself has even stated that his CAPE theory should not be used to time the market.
Interesting you brought up price to sales. The "inventor" of that metric is Ken Fisher who is the sources below.
Here are a couple things worth viewing and reading.
https://www.cnbc.com/video/2017/10/2...en-fisher.html
https://www.realclearmarkets.com/art...ns_495670.html
__________________
Retired 1/6/2017 at 50 years old
Immensely grateful
“The most important quality for an investor is temperament, not intellect.”—Warren Buffett
|
|
|
03-05-2021, 09:10 AM
|
#18
|
Thinks s/he gets paid by the post
Join Date: Jun 2006
Posts: 1,675
|
Valuations matter if you're investing.
They don't matter if you're speculating.
Apparently Ken Fisher thinks euphoria matters. What does euphoria look like? See the ratio of NASDAQ to NYSE volume above.
__________________
Emancipated from wage-slavery since 2002
|
|
|
03-05-2021, 09:33 AM
|
#19
|
Full time employment: Posting here.
Join Date: Dec 2016
Posts: 510
|
Quote:
Originally Posted by twaddle
Valuations matter if you're investing.
They don't matter if you're speculating.
Apparently Ken Fisher thinks euphoria matters. What does euphoria look like? See the ratio of NASDAQ to NYSE volume above.
|
Heavy volume of one index over the other does not constitute "euphoria".
Valuations are one measure I think is his point. Not the end all as some are led to believe. It's not that simple. The 1 , 3 and 5 year returns show that.
Take 2009. The S&P 500’s trailing 12-month P/E soared to levels unseen since the dot-com crash, thanks to putrid late-2008/early-2009 profits dragging down the P/E’s denominator more than prices fell. Yet that formed the beginning of history’s longest bull market—a generational buying opportunity.
__________________
Retired 1/6/2017 at 50 years old
Immensely grateful
“The most important quality for an investor is temperament, not intellect.”—Warren Buffett
|
|
|
03-05-2021, 09:47 AM
|
#20
|
Thinks s/he gets paid by the post
Join Date: Jun 2006
Posts: 1,675
|
Oh, no question about it, "E" is volatile. A lot of the metrics in this thread take that into consideration.
What's the euphoria metric? Kids yelling "gamestonk!" seems pretty good to me.
__________________
Emancipated from wage-slavery since 2002
|
|
|
 |
|
Currently Active Users Viewing This Thread: 1 (0 members and 1 guests)
|
|
Thread Tools |
Search this Thread |
|
|
Display Modes |
Linear Mode
|
Posting Rules
|
You may not post new threads
You may not post replies
You may not post attachments
You may not edit your posts
HTML code is Off
|
|
|
|
» Recent Threads
|
|
|
|
|
|
|
|
|
|
|
|
|
» Quick Links
|
|
|