I'll also say 'Thanks' to REWahoo for sharing, it motivated me to take another look at where I'm at, and that's always a good thing.
My situation isn't apples-to-apples, DW still working, and no SS yet, and no real large purchases (but a string of medium-to-large, but not unexpected ones - room addition, patio, kitchen appliances, house painted, new car). But actual spending is a little over 4% of starting portfolio. But it has a lesser effect on portfolio with DWs (moderate) income (actual outflow is less than 4% with that income offset). NW is up ~ 15% from EOY2003, so all things considered, I'm happy. Esp when we hear what a terrible time this was in the economy.
Am I the only one to find Firecalc graphs not helpful ?
")
To me the graph below does not say much...
The graphs speak volumes. And they are super-helpful. One (of the many things) they say is that there is a wide range of historical outcomes. We can't know which path we will be on, or if future paths will be different, but it is still informative.
Let's say you plan a vacation, and it is the rainy season where you are going. That doesn't mean you will get rained out (or that you won't get rained out in the dry season), but you have some history and some range of expectations. It is still helpful information.
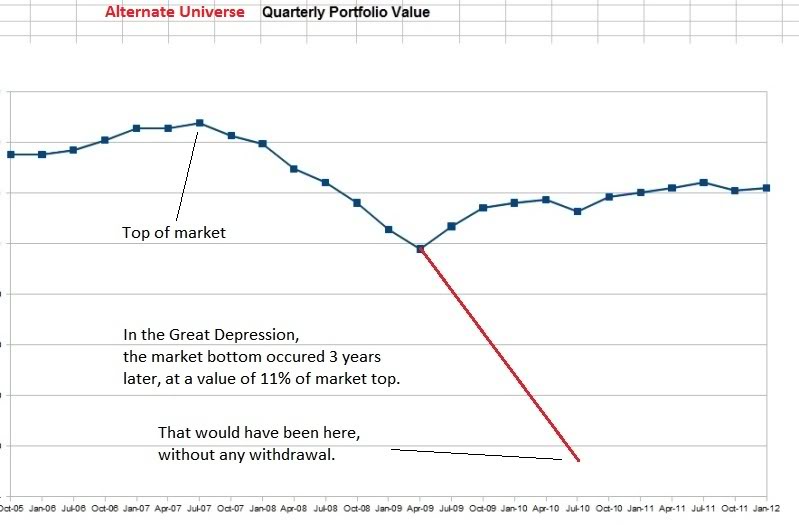
Thank heaven history did not repeat (knock on wood), because in the Great Depression, the Dow lost nearly 90% of its value. To put that in perspective, I took the liberty to draw up an alternative scenario.
Should we all kiss Bernanke or what?
Or is it too early? 
Yes, but I don't think REWahoo would be drawing those %'s if he retired right at a 1929 level peak. This is where we start talking valuation....
-ERD50
 time!
time!