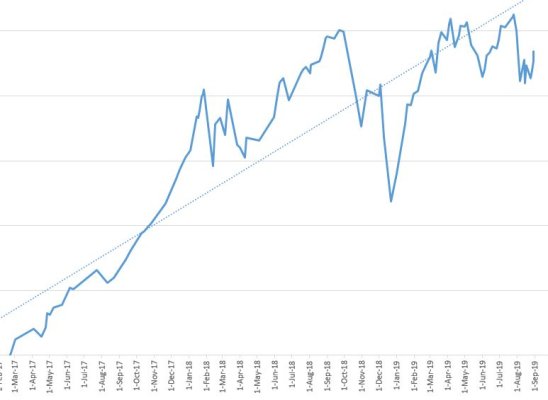
2019 YTD Investment Performance Thread

June 2019

  • +14.21% Total Portfolio Value increase YTD (End of June)
  • +10.36% YTD Performance (End of June), total pie weighted
  • 50-45-05 (Stk-Bnd-Csh) Target AA
June was a fantastic month for investing and saving. FYI, off-screen we have two salaries (mine reduced 40% this year), and our monthly spend comes out of that. So it really is a rosy picture.

RLBGX American Funds Balanced R6 is +11.09% YTD according to M*. I hold that 50/50 fund in one of my 401k accounts, and it looks like a good barometer (or proxy) for overall performance of our AA.
:clap:
July 2019

  • +15.27% Total Portfolio Value increase YTD (End of June)
  • +10.00% estimated YTD Performance (End of July), total pie weighted
  • 50-45-05 (Stk-Bnd-Csh) Target AA
July was such a long time ago! Got busy and did not record the YTD performance. I'll call it 10% and move on.

I've noticed this thread has become less fun, and fewer posts...
 
Up 9.54% through July despite today's (7/31) market drop.

S&P 500 is up about ~19% YTD and I don't think it will end that high come 12/31/2019. Call it a hunch. :blush:

Up 8.9%. Did some day trading this month to make up for the relatively stagnant market.
 
After 8 innings up 11%. I will take that with a smile.
 
after 8 innings up 11%. I will take that with a smile.

+1 Given how dismal the news on the stock market over the past month I was pleasantly surprised that the impact on YTD return was pretty insignificant.

1/31/20195.10%
2/28/20197.02%
3/31/20198.08%
4/30/201910.56%
5/31/20196.83%
6/30/201911.34%
7/31/201911.96%
8/30/201910.91%
 
Last edited:
^ it is pretty amazing to me also, that we are as well off as we are, like you mentioned. Been very interesting year so far. LOL
 
July 2019

  • +15.27% Total Portfolio Value increase YTD (End of June)
  • +10.00% estimated YTD Performance (End of July), total pie weighted
  • 50-45-05 (Stk-Bnd-Csh) Target AA
July was such a long time ago! Got busy and did not record the YTD performance. I'll call it 10% and move on.

I've noticed this thread has become less fun, and fewer posts...
August 2019
  • +14.30% Total Portfolio Value increase YTD (Aug-2019)
  • +09.47% Estimated YTD Performance (Aug-2019), total pie weighted
  • 50-45-05 (Stk-Bnd-Csh) Target AA
Two benchmarks for managed 50/50 portfolio:
  • 50/50 Wellington/Wellesley 13.825%
  • 50/50 American Funds American Balanced Fund 11.74%
 
As of 9/1/2019 net worth up about 8.7% from 1/1/2019.

Had child wedding expenses and Roth conversion taxes paid during this but new income savings also.

Expect similar expenditures, a different wedding and contributions this coming year 2020 also.
 
1/31 +10% YTD Over half recovered from my terrible Nov/Dec '18
2/28 +14.57% and almost back to my 52 week high.just another ~4.5% to break the 52 week high
3/31 +16.75% and I was beating all three major indexes...
4/30 +21% 52week high, net worth at record highs, liabilities at all time lows...blessed.
5/31 +13.27% nice little 7% tariff haircut. Oh, I know it was priced in eh?
6/28 +21.46% regaining my 52 week high from back in April I'll take an 8% month .
7/31 +25% as you can see, growth has slowed first 3 months provided 65% of my YTD
8/31 +22.5% backpedaled a bit. Up double digits yeqr over year. Happy Labor day y'all blowin the dough at a 5 star with the family
 
+11.6%
 
Last edited:
Investments up 8.8% through the end of August. Still well ahead of my SWR, so I am happy with that. Cash + investments up 5.3%, market gains still well ahead of our living expenditures.
 
+26.4%, but 9% of that is a single ESOP stock...17.1% without the stock
 
+11.60% as of August 30, 2019
Asset Allocation : 69/28/3 (Stock/Bond/Cash)
Pleasantly surprised to see how the portfolio recovered in the latter half of August.
 
+13.7% on 8-30-2019, Nominal AA of 50/50. Even VBTLX has been on a tear this year at +9.33% YTD.
 
Time for my monthly check in. Here's my results, so far this year...

1/31/19: +7.94%
2/28/19: +11.4%
3/31/19: +12.8%
4/30/19: +15.6%
5/31/19: +10.4%
6/28/19: +15.9%
7/31/19: +17.8%
8/31/19: +17.4%

And, as before, that's rate of return, rather than just how much my net worth has changed, since that would be thrown off by additional investments.

Anyway, August was looking like a rocky month for a bit, but thankfully, mostly recovered. I think I bounced around between +15% and +19% for the year, so while it could have been better, it could have been a helluva lot worse!
 
I suspect those one year returns include the big drop from late last year. My YTD number is much better than my 12 month number.
October and December were stinkers in 2018. I'm expecting at least two more stinkers this year.
:(
 
I suspect those one year returns include the big drop from late last year. My YTD number is much better than my 12 month number.

Yep, definitely. While I'm up around 17.4% YTD, if I look at the 12 month totals, I'm only up around 2%, versus 8/31/18. I went slightly higher by the end of September, but not very much. By Christmas Eve, I had gotten knocked down about 16-17%, and finished the year down about 13%, from that Aug/Sep high.
 
+11.3%, all-in. Nice window dressing, as earlier in the month is was a couple of points lower.
 
14.9% YTD. Close to flat from one year ago. Or 18 months ago. Or 6 months ago. This volatility should create lots of opportunities for the traders that are smarter than I am!
 

Attachments

  • 1Sep19YTD.JPG
    1Sep19YTD.JPG
    42.1 KB · Views: 25
YTD (August 30, 2019) returns for a collection of 'close-to' 60/40 funds (from Morningstar.com and Vanguard.com):

12.34% VSMGX Vg LifeStrategy Moderate Growth (60/40)
14.64% VBIAX Vg Balanced Index (60/40), no foreign
10.27% DGSIX DFA Global 60/40 I, small-cap & value tilted
12.46% VTTVX Vg Target Retirement 2025 (62/38)

11.67% VTWNX Vg Target Retirement 2020 (53/47)*
14.63% VWENX Vg Wellington (67/33)*

Some others
01.59% VMMXX Vg Prime Money Market
09.32% VBTLX Vg Total US Bond Index
05.98% VSCSX Vg Short-term corporate bond index
17.99% VTSAX Vg Total US Stock Market
08.51% VTIAX Vg Total Int'l Stock Market
25.78% VGSLX Vg REIT Index
10.20% VSIAX Vg Small Cap Value Index
21.75% MTUM IShares USA Momentum Factor ETF

*These 2 funds VTWNX and VWENX are outliers because they are not that close to a 60/40 asset allocation this year.

The August 30 numbers should be the same as the August 31 numbers because it's a weekend.

Though the balanced funds are about where they stood the past 2 months, the underlying asset classes had some action: Bond funds are up, international are down, REITs are up, US small-caps are down.
 
Back
Top Bottom