Lsbcal
Give me a museum and I'll fill it. (Picasso) Give me a forum ...
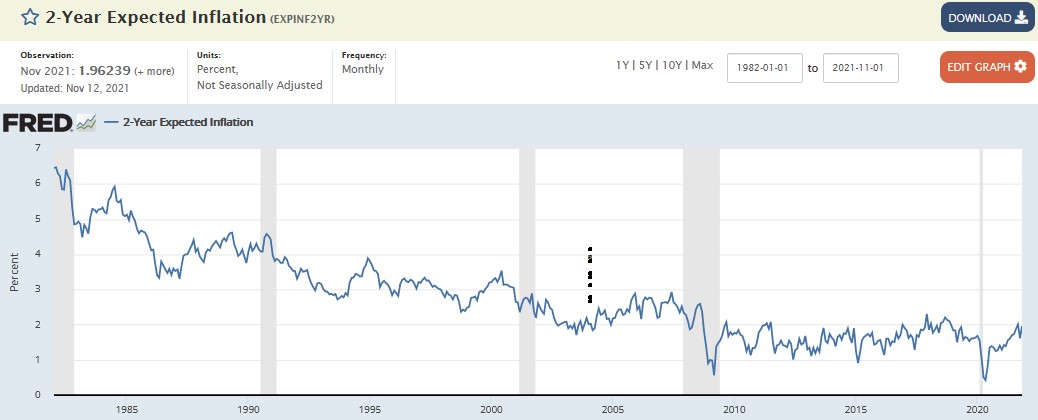
I am posting this since many here are somewhat concerned about inflation. The Fed has come out with a set of new graphs showing various measures of expected inflation. Here is a link to the 35 charts in this series:
https://fred.stlouisfed.org/release?rid=500&utm_medium=email&utm_campaign=FRED%20Data%20News%201221&utm_content=FRED%20Data%20News%201221+CID_e44aa0c560fa4688d9b0e0b0bdce6c50&utm_source=Research%20newsletter&utm_term=35%20new%20series
For instance, the 2 year inflation expectations in the markets are shown here:
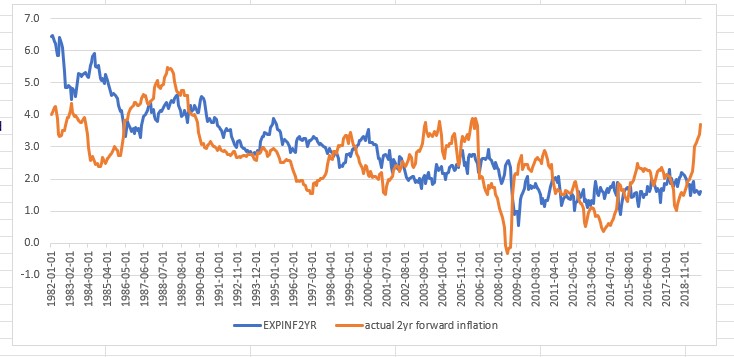
I have not done it but would be interested to see something like the 2 year expected inflation together with the actual 2 year inflation in the same chart. Would be interesting to see how expectations anticipated reality.
https://fred.stlouisfed.org/release?rid=500&utm_medium=email&utm_campaign=FRED%20Data%20News%201221&utm_content=FRED%20Data%20News%201221+CID_e44aa0c560fa4688d9b0e0b0bdce6c50&utm_source=Research%20newsletter&utm_term=35%20new%20series
For instance, the 2 year inflation expectations in the markets are shown here:
I have not done it but would be interested to see something like the 2 year expected inflation together with the actual 2 year inflation in the same chart. Would be interesting to see how expectations anticipated reality.