Latest Inflation Numbers and Discussion

Status
Not open for further replies.
IMHO, using food is a mistake. It's too variable for all sorts of reasons: weather, location, local zoning laws, amount of competition in the area, etc.

That's why we have the core inflation number.

IMO, inflating our way out of this huge increase in deficit spending may be an option to some in government.
 
Last edited:
IMHO, using food is a mistake. It's too variable for all sorts of reasons: weather, location, local zoning laws, amount of competition in the area, etc.

That's why we have the core inflation number.

IMO, inflating our way out of this huge increase in deficit spending may be the only option to most in government.

How I see it (bolded).
 
It is pretty much accepted that the inflation numbers are a lie.
 
Moderator Note: Can we please avoid the conspiracy theories? That's the type of thing that will end up closing the thread.
 
I never paid that much attention to grocery prices. Food cost is not a big percentage of our total expenses plus my wife is more cognizant of this matter, although I drive her to run food errands twice a week.

Out of curiosity, I looked up the total grocery bills in the last 12 months, 8/11/2022-8/11/2023, and compared that to the total in the period 1/1/2019-1/1/2020.

To my surprise, the increase was 1.68X. Whoa, a 68% increase. I did not eat more expensive food, nor in higher quantities...

Wanting to understand food costs more, I looked up our grocery bills going back to 2010, the 1st year I started using Quicken to download credit card expenses.

And to add to my surprise, I found out that 2019's grocery bills were unusually low. It was less than 1/2 what we spent in 2015.

And last year, in 2022, we spent only 74% what we did in that year 2015. And that's in nominal dollars. With inflation accounted for, 2015 would be an even more gluttonous year.

Something very strange is going on here. In short, 2015 was unusually high, and 2019 was unusually low. It's a mystery. But I see now that my numbers are so erratic, I cannot draw any conclusion from them.
 
But I don't know the number for just food. The CPI of 1.17x is for everything.

And then, maybe my wife has been buying filet mignon to cut up for the vegetable stir fry and does not tell me.


Just trust us on this. The gummint numbers are correct.
 
But I don't know the number for just food. The CPI of 1.17x is for everything.

And then, maybe my wife has been buying filet mignon to cut up for the vegetable stir fry and does not tell me.

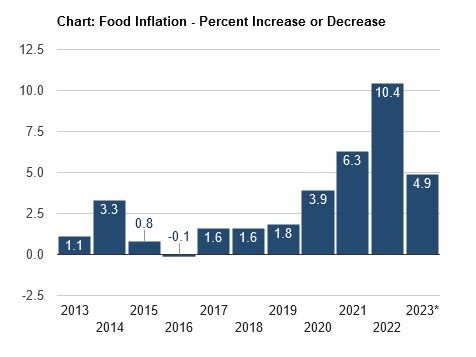
You are missing the big year of late 2021 to 2022. This is when fertilizer, John Deere tractors, shipping and everything to do with food production went through the roof. The rise of 2022 didn't go away. Just because it is 4.9% today, doesn't erase 2021-2022. And I think that is what some people are complaining about when I said "Food is down" and I meant month to month, not multi-year to multi-year.

It is also depending on your basket. Our basket is loaded with some nasty items like natural peanut butter. That's gone up nearly 25% in the last two years.

Source: https://www.usinflationcalculator.com/inflation/food-inflation-in-the-united-states/
 

Attachments

  • foodinflation.JPG
    foodinflation.JPG
    26.4 KB · Views: 34
Just trust us on this. The gummint numbers are correct.

Actually, we have every reason to believe the published data about our economy, including CPI. Every top university, a number of independent economic research and policy NGOs, and even some investment banks, track these same numbers independently and study them carefully. If there were any meaningful or systemic differences they would be broadcast immediately and endlessly around the world. The absence of any serious research showing our economic data to be miscalculated is the greatest testament to its veracity.
 
Last edited:
While we were in California this past week, we bought a package of 3 bell peppers; yellow, orange and red. $6.99. I did not see where they were produced. Here in SW PA, they are $3.99, as we picked up a pack on the way home from the airport. They were from Canada, but that's our usual price unless we buy them individually on sale.
 
While we were in California this past week, we bought a package of 3 bell peppers; yellow, orange and red. $6.99. I did not see where they were produced. Here in SW PA, they are $3.99, as we picked up a pack on the way home from the airport. They were from Canada, but that's our usual price unless we buy them individually on sale.

They are worth every penny. :LOL:

Seriously, after my pepper crop completely failed this year, I admire anyone who successfully grows these temperamental crops. There's a lot of work involved. The inflation likely reflects the large labor and pest management component of this crop.
 
Gas prices certainly have gone up and housing prices are still high due to limited inventory and low demand as a result of high interest rates. I think inflation will rise even further between now and end of year. Might make for a bumpy stock market.
 
I have to disagree here, not cherry picking, our food costs have gone down progressively over the last 4 months. We are spending about 30% less than we were previously at the peak and back to our monthly norms now which really have not changed significantly for the last 3 or so years. Except for a short peak that is now over.

Wow, I hope that trend extends over to my area. We're nowhere near where we were 3 years ago. There are a few commodities which haven't increased as much as the average, but that's more than offset by those which skyrocketed and stayed there.

I've noticed a real dichotomy here between those of us looking at true household inflation, and those looking at abstract charts. Of course you can choose any basket of goods, and any measurement methodology. You can get numbers which represent anything you want. I'm not suggesting these don't have value for their intended purpose. Or that it's a conspiracy. Just that they're clearly not measuring what average households are experiencing.
 
Yes, I apologize if I was implying conspiracy theories to inflation when I said the numbers are a lie. I meant that the inflation numbers do not always represent the true cost of inflation.

Housing, fuel, medicine, food.

Ok, take for an example I-bonds. We bought $1000 denominations of I-bonds in 2011. I redeemed one in August 2023 for $1350. That would imply that cost of items has increased 1.35x since 2011.

Median cost of a home in 2011 was $227,000. Median cost of a home in 2022 was $454,000. According to the I-bond, it should be around $307,000.

You can discount this and that, but at the end of the day, $1350 does not seem to provide the same stuff as $1000 did in 2011.

Housing inflation is a very local phenomenon. If you are in a desirable coastal area your prices may have risen steeply. If you are in a small, dying rural town in the middle of nowhere, they probably have not. There is no way an I-bond can ever reflect that complexity.
 
Last edited:
Yes, I apologize if I was implying conspiracy theories to inflation when I said the numbers are a lie. I meant that the inflation numbers do not always represent the true cost of inflation.

Housing, fuel, medicine, food.

Ok, take for an example I-bonds. We bought $1000 denominations of I-bonds in 2011. I redeemed one in August 2023 for $1350. That would imply that cost of items has increased 1.35x since 2011.

Median cost of a home in 2011 was $227,000. Median cost of a home in 2022 was $454,000. According to the I-bond, it should be around $307,000.

You can discount this and that, but at the end of the day, $1350 does not seem to provide the same stuff as $1000 did in 2011.

Of course the CPI does not attempt to track the cost of a home purchase. They track rents. A home purchase is an investment in real estate.

I think it is kind of tough to call the government figures which on a monthly basis track pricing of multiple goods and services consistently a "lie" when you are simply comparing them to your own personal perceptions or to the cost of something which is not even a part if the CPI.
 
Inflation has cooled quickly this cycle. But the monthly figures tell an even more promising story.

From the article:

Annualized 6 month CPI trend
2.52%
Annualized 3 month CPI trend
1.89%

Core CPI?
O. 2% each of the past two months or 2.4% annualized.

Have we seen the last Fed hike of the cycle? Time will tell.

https://www.theweeklyjournal.com/bu...cle_b5a491c2-37c5-11ee-a2a9-33570d3bc5c8.html

The referenced article is cherry-picking data and then implying that the inflation war is over.

The Fed uses a 12-MONTH moving average of inflation data, NOT 2-MONTH.

I hope most here understand why the Fed uses a longer range of data than the 3 months referenced by the author of the linked article.

Some of the data are known to require long dead times from the time a rate is increased until the resultant data point reflects the impact of the move.
 
Actually, we have every reason to believe the published data about our economy, including CPI. Every top university, a number of independent economic research and policy NGOs, and even some investment banks, track these same numbers independently and study them carefully. If there were any meaningful or systemic differences they would be broadcast immediately and endlessly around the world. The absence of any serious research showing our economic data to be miscalculated is the greatest testament to its veracity.


That's why I said the gummint numbers are correct. They would have no reason to lie to us.
 
The referenced article is cherry-picking data and then implying that the inflation war is over.

The Fed uses a 12-MONTH moving average of inflation data, NOT 2-MONTH.

I hope most here understand why the Fed uses a longer range of data than the 3 months referenced by the author of the linked article.

Some of the data are known to require long dead times from the time a rate is increased until the resultant data point reflects the impact of the move.

Analyzing the latest data is in fact valid and most economists and analysts look at it. The annual number has one new data piece and 11 stale ones. The newest data identifies the current rate of increase. If recent data were showing much higher rates than the 12 month rate, that would be cause for alarm.

The three and six month data and even shorter periods are valid for discerning trends. You may prefer a different period which is fine.
 
Gas prices certainly have gone up and housing prices are still high due to limited inventory and low demand as a result of high interest rates. I think inflation will rise even further between now and end of year. Might make for a bumpy stock market.

Have they? There is a shopette on the corner that used to pump gas. I moved here in 2012. That shop stopped pumping gas sometime prior to my arrival. The price on the sign is $3.60 for 87. The price at the nearest station that is still pumping gas today is $3.43 for 87. Sometime prior to 2012 we were paying $3.60/gal or more. My assumption: I was paying more than $3.60/gal 11 years ago. Gas is cheaper (for me) today then it was 11 years ago. My income has increased. Hence, gasoline disinflation.
 
Here is an interesting site that "suggests" gas prices (with all their usual ups and downs) have remained reasonably stable at the equivalent of about $4.25 (my average - not theirs.)


I have no idea if this is correct, but I wouldn't doubt that the prices have been "stable" if you forget the wild fluctuations that we see over months or even years at a time.


https://www.usinflationcalculator.com/gasoline-prices-adjusted-for-inflation/
 
BLS looks for sales! ? !

All this talk of our personal inflation and sales got me digging.

First of all, the "basket of food" is not a secret. It is right there in the CPI report. You have to go to the more detailed tables.

I noticed that peanut butter is thrown in with "other fats" such as olive oils. This is only 0.115% of CPI, whereas "soup" is 0.109%. We barely have any soup. So it doesn't match our experience, but they gotta pick something, and they do adjust the importance over the years. For example, tobacco is nowhere near as important as it used to be.

Anyway, back to sales and substitutions. Turns out the BLS survey shoppers do some shopping! This is really interesting. I think it reflects reality as there have been published reports that WalMart has attracted more wealthy shoppers in the recent years. This is the kind of "equivalent" substitution that BLS does.

BLS has a whole FAQ on many of the discussions we are having right now. It is worth a read. I just present to you a small excerpt below, along with the source for the whole document.

Source: https://www.bls.gov/cpi/factsheets/common-misconceptions-about-cpi.htm

When the cost of food rises, does the CPI assume that consumers switch to less desired foods, such as substituting hamburger for steak?

No. In January 1999, the BLS began using a geometric mean formula in the CPI that reflects the fact that consumers shift their purchases toward products that have fallen in relative price. Some critics charge that by reflecting consumer substitution the BLS is subtracting from the CPI a certain amount of inflation that consumers can "live with" by reducing their standard of living. This is incorrect: the CPI's objective is to calculate the change in the amount consumers need to spend to maintain a constant level of satisfaction.

Specifically, in constructing the "headline" CPI-U and CPI-W, the BLS is not assuming that consumers substitute hamburgers for steak. Substitution is only assumed to occur within basic CPI index categories, such as among types of ground beef in Chicago. [Joe comment: they go to WalMart, LOL] Hamburger and steak are in different CPI item categories, so no substitution between them is built into the CPI-U or CPI-W.

Furthermore, the CPI doesn't implicitly assume that consumers always substitute toward the less desirable good. Within the beef steaks item category, for example, the assumption is that consumers on average would move up from flank steak to filet mignon if the price of flank steak rose by a greater amount (or fell by less) than filet mignon prices. If both types of beef steak rose in price by the same amount, the geometric mean would assume no substitution.

In using the geometric mean the BLS is following a recognized best practice for statistical agencies. The formula is widely used by statistical agencies around the world and is recommended by, for example, the International Monetary Fund and the Statistical Office of the European Communities.
 
Last edited:
Analyzing the latest data is in fact valid and most economists and analysts look at it. The annual number has one new data piece and 11 stale ones. The newest data identifies the current rate of increase. If recent data were showing much higher rates than the 12 month rate, that would be cause for alarm.

The three and six month data and even shorter periods are valid for discerning trends. You may prefer a different period which is fine.

Monte - it's just a point of discussion for me. Nobody knows anything for sure so I don't use the current Fed data postulations to make decisions.

I follow posts from you and several others here and try to keep extending the ladder as my T-bills/bonds/CDs mature. I look for the best purchases at the time that are within my risk tolerance, purchase them, and wait until the next maturity date to repeat.

I wish that I was better at picking corp bonds from the secondary market but find that it takes me a tremendous amount of time to query/screen and review to find good candidates. So much to learn.
 
Yeah, I have to call BS on this, too. Of course you could cherry-pick the "on sale" price today and compare it to, say, the Avian Flu spike in egg prices. But we all know that it would be flat out dishonest to use that to bolster a claim that prices are "down."

Anyone who looks at prices knows that there's been a historically significant, broadly-based increase over a relatively short time, and that the "official" government numbers don't match the reality we're all experiencing.

Wow, I hope that trend extends over to my area. We're nowhere near where we were 3 years ago. There are a few commodities which haven't increased as much as the average, but that's more than offset by those which skyrocketed and stayed there.

I've noticed a real dichotomy here between those of us looking at true household inflation, and those looking at abstract charts. Of course you can choose any basket of goods, and any measurement methodology. You can get numbers which represent anything you want. I'm not suggesting these don't have value for their intended purpose. Or that it's a conspiracy. Just that they're clearly not measuring what average households are experiencing.


Well said. And I see substitution was mentioned in another post so that the CPI numbers are lower. But in reality, you can't keep making the same substitutions every year. If I already switched to some cheap Walmart product several years ago, that's only helped my personal inflation the year I did it. But the CPI always factors in that you can make that substitution. I'll be off to the the grocery store later today - dreading seeing the latest round of price increases. Gas already jumped back up all the way to $4/gal.
 
Last edited:
Status
Not open for further replies.
Back
Top Bottom