TL-DR summary:
Use a retirement planning tool to determine the best time to take SS. Run different scenarios.
Verbose part:
I'm afraid I had to use various retirement planning tools to determine when we should take social security. My initial inclination was to believe it shouldn't matter, but as it turns out it does matter a fair amount and particularly with regards when poor stock market conditions prevail - at least for our particular circumstances.
Background: I'm 62 this year, wife is 63. We have stock, bond, and cash assets of ~$740k and last three years our average after-tax expenses have been ~$68k/year and I don't expect that to change when we retire this summer. If we take SS this year, I would receive $1602/mo and wife $1947/mo. At age 70 the numbers (according to the worksheet I used on SS web site since the normal SS projections assume continued employment till 70) the SS would be $2811/mo and $3088/mo respectively. House was purchased for cash ~$330k in 2006 - current value unknown. So we are definitely on the low side of assets for retiring now, given our annual expenses. But I have run the numbers in Fidelity planner, Pralana Gold Retirement calculator (worth the price IMHO,) and FIRE Calc - all say the odds of living off our assets and delaying taking SS at 70 is pretty good (by my estimate of acceptable risk) and definitely superior to taking SS now or any time before 70 (or 69).
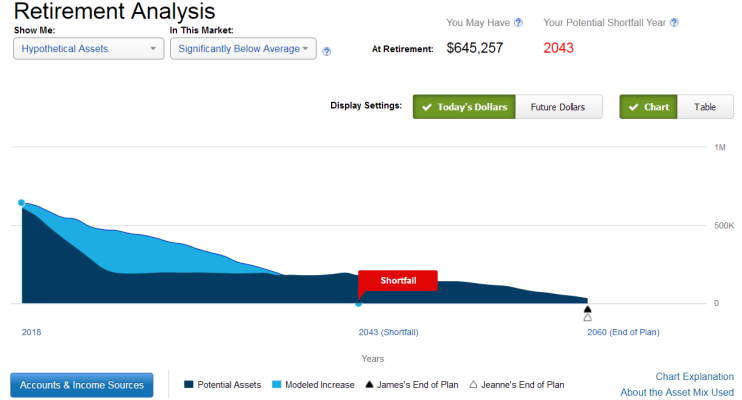
I'm attaching the graphs from the Fidelity planner (Pralana has some nice graphs of this too, but people here are probably more used to the better known Fidelity tool.) The color coding isn't quite consistent between graphs, so I'll try to explain what they show:
In this graph, the model shows what happens on average in the 10% worst conditions (kind of - read Fidelity's explanation in the last screen snip.) The dark blue curve is the asset balance when we take SS at age 70. The light blue curve is the average asset balance when we take SS this year (62 & 63). Obviously the assets decline slower by starting SS this year but run out sooner absent any expense reduction. But in bad markets we'd have a long tedious life of eking it out trying to preserve any liquid assets by taking SS now. SS at 70 allows us to live our current life style possibly indefinitely even in bad market conditions.

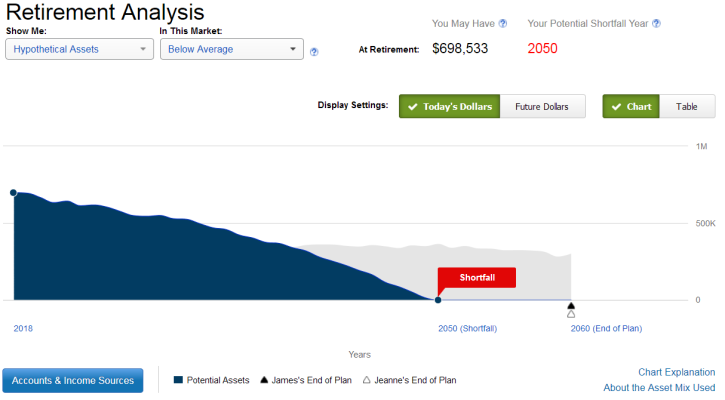
In this graph, the grey curve is the case of taking SS at 70 and blue curve is taking SS this year (the SS @ 70 curve that is obscured by the blue curve showed a similar though less severe decline in assets that is shown in the earlier figure.) This model shows what happens at Fidelity's 75% confidence level. Note that in 2050, when the assets for the SS@Now scenario hit zero, wife and I would be 94 & 95 years old. For a lot of people that is plenty long enough planning range (I'm a semi-optimist and put in 104 & 105 as drop-dead ages. An optimist would use 115.

)
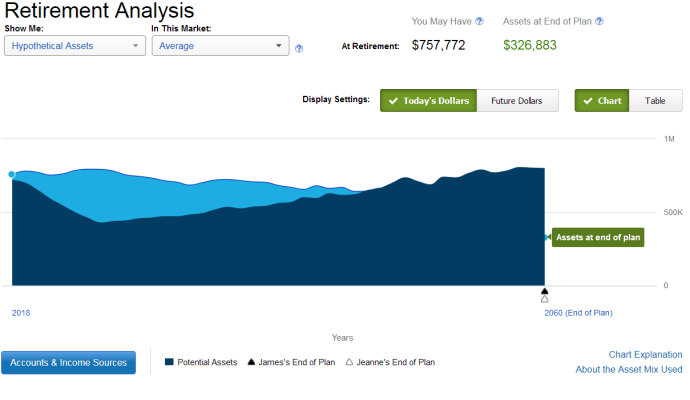
In this graph, the dark blue curve is the case of taking SS at 70 and the light blue is taking SS this year. As you can see, this "average" market case is the only one where taking SS early (
in our unique set of circumstances) yields higher average assets over most of our life-spans, dipping below the SS@70 case only in the last few decades.
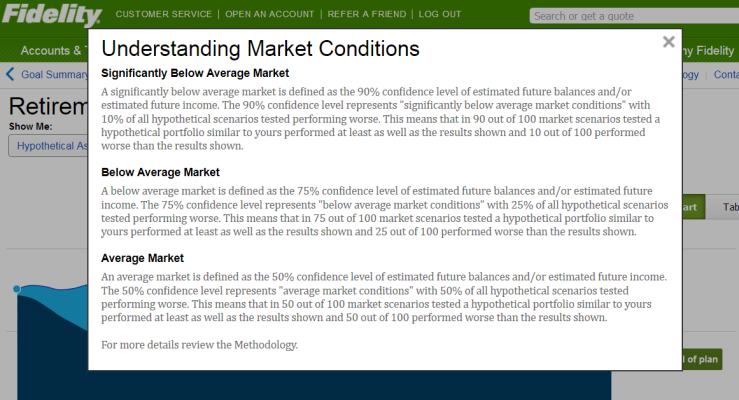
Lastly, here's Fidelity's explanation of their market conditions: