Firecalc results low portfolio balance glitch.

Status
Not open for further replies.

Rosie

Recycles dryer sheets
Joined
Jun 20, 2010
Messages
438
Location
Sac suburb
Hi, I was running some scenarios on Firecalc and I found an error in the results report.

Whenever I do a run where the lowest portfolio balance at the end of 30 years is larger than the starting portfolio balance, the written "Here is how your portfolio would have fared" section always just brings back the starting portfolio balance as the lowest balance at the end of 30 years, even though the graph shows a much larger final balance.

For example, using only the Firecalc default values and varying the starting portfolio amounts, here's what I see:

Spending: 30000
Portfolio: (varies)
Full Years: 30

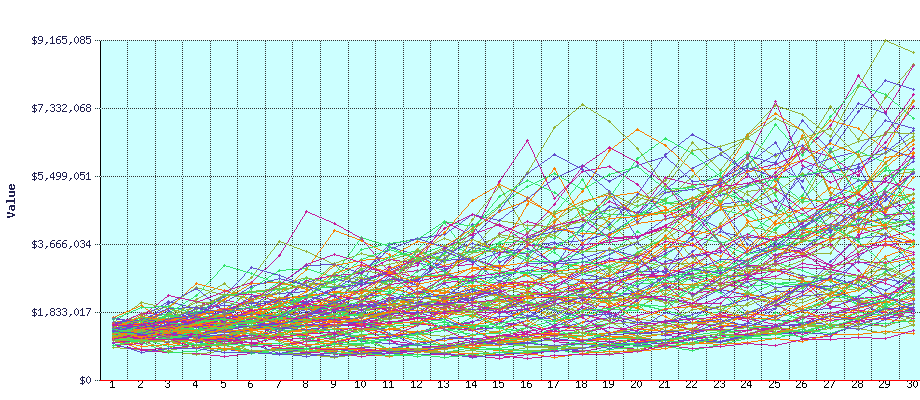
750,000 (default): The lowest and highest portfolio balance at the end of your retirement was $-300,739 to $4,259,606, with an average at the end of $1,421,948.

1,000,000: The lowest and highest portfolio balance at the end of your retirement was $546,203 to $6,585,050, with an average at the end of $2,713,579.

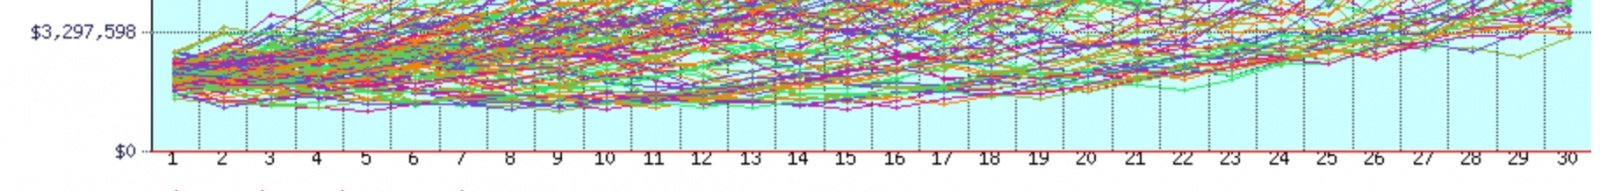
1,500,000: The lowest and highest portfolio balance at the end of your retirement was $1,500,000 to $11,235,937, with an average at the end of $5,296,843. (The lowest 30-yr balance shown on the graph appears close to 2.2 million.)

2,000,000: The lowest and highest portfolio balance at the end of your retirement was $2,000,000 to $15,886,825, with an average at the end of $7,880,107. (The lowest 30-yr balance shown on the graph appears close to 3.3 million.)

When the lowest 30-year balance is less than the starting portfolio balance, the numerical value agrees with what's shown on the graph. It only seems to be an issue when the lowest final balance is greater than the starting balance.

I wonder if this glitch also affects the average ending balance? That's a number I like to compare when I'm running different scenarios.
 
2,000,000: The lowest and highest portfolio balance at the end of your retirement was $2,000,000 to $15,886,825, with an average at the end of $7,880,107. (The lowest 30-yr balance shown on the graph appears close to 3.3 million.)

I believe you're just misreading the graph.
From this example, I get the following, which appears to be the $2M cited in the results verbiage.
 

Attachments

  • Screenshot 2023-12-11 at 13.56.04.jpg
    Screenshot 2023-12-11 at 13.56.04.jpg
    140.2 KB · Views: 13
This is a long-standing bug in FIRECalc. Any time the lowest ending balance is above the starting balance, it incorrectly reports the starting balance as the lowest ending balance. Unlikely to get fixed as there have been no bug fixes in years, just data updates.

Good question about the average - I don't know how it is calculated.
 
2,000,000: The lowest and highest portfolio balance at the end of your retirement was $2,000,000 to $15,886,825, with an average at the end of $7,880,107. (The lowest 30-yr balance shown on the graph appears close to 3.3 million.)

When the lowest 30-year balance is less than the starting portfolio balance, the numerical value agrees with what's shown on the graph. It only seems to be an issue when the lowest final balance is greater than the starting balance.

I wonder if this glitch also affects the average ending balance? That's a number I like to compare when I'm running different scenarios.
This is confusing wording in the description of the output. What it should say is $2000000 is the lowest balance across the plan analysis.
 
No, I really don't see a bug. Perhaps it should have said "At the end of your retirement, the lowest balance you had during the retirement was $XXX". That would make it clearer, but I think it's OK as is.
 
No, I really don't see a bug. Perhaps it should have said "At the end of your retirement, the lowest balance you had during the retirement was $XXX". That would make it clearer, but I think it's OK as is.

+1
 
It just tells you what the lowest balance was anytime during the planning period (which will usually be the starting balance but could, in certain circumstances, be less at the end.) If you have some concern about leaving a bequest, you can put the desired bequest in the last blank on the "investigate" tab and it will solve for that.
 
No, I really don't see a bug. Perhaps it should have said "At the end of your retirement, the lowest balance you had during the retirement was $XXX". That would make it clearer, but I think it's OK as is.

It just tells you what the lowest balance was anytime during the planning period (which will usually be the starting balance but could, in certain circumstances, be less at the end.) If you have some concern about leaving a bequest, you can put the desired bequest in the last blank on the "investigate" tab and it will solve for that.

I do not believe this is the case. If you put in, say, $1,240,000, Firecalc will report that they lowest point at the end was $1,240,000 (as the OP experienced). But this was NOT the lowest balance during the planning period. in other words, some cycles started at $1,240,000 and then dipped lower, but they all eventually climbed above $1,240,000. You can see this in the attached graph. (I chose that particular starting value because any lower starting value had some final values lower than the starting value.)
 

Attachments

  • line-graph.php.png
    line-graph.php.png
    66.3 KB · Views: 7
No scenario that I have ever run for myself has had a value at any time lower than the starting amount, but apparently it can happen, as I see that apparently occurring in the graph you posted. But then I also never thought of comparing scenarios by comparing the hypothetical end value; I just compared the probability of success percentages if I changed spending or portfolio composition.

I guess the more important question to ask the OP is "what are you trying to learn." The main question that FIREcalc answers is, based on your own portfolio and historical performance since 1871, what is the likelihood you will run out of money (i.e. balance goes to zero) within a certain period of time? Figuring out the hypothetical ending balance was not, I believe, the primary purpose of the model.

However, you can tweak certain parameters to give you a rough idea about other things. So, depending on the question, maybe there's a way to tweak the model to get close to an answer. I suggested earlier the "leave a bequest" input on the "Investigate" tab, because that sets the lower bound above zero for determining a failure at any point during the time period selected. You could compare scenarios by changing that input and seeing what happens to success rate rather than to comparing the lowest ending balance.

Just an FYI for everyone: None of the current site staff had a hand in creating the model or has the ability to modify it.
 
Last edited:
This is a long-standing bug in FIRECalc. Any time the lowest ending balance is above the starting balance, it incorrectly reports the starting balance as the lowest ending balance. Unlikely to get fixed as there have been no bug fixes in years, just data updates.

Good question about the average - I don't know how it is calculated.

I agree based on the many prior posts on this situation and playing around with it myself.
 
.....................Just an FYI for everyone: None of the current site staff had a hand in creating the model or has the ability to modify it.


That's good to know. I guess I never look that close at the numbers, beyond % chance of success. And I run another calculator or 2 which have similar results. I think we're good to go. :)
 
I do not believe this is the case. If you put in, say, $1,240,000, Firecalc will report that they lowest point at the end was $1,240,000 (as the OP experienced). But this was NOT the lowest balance during the planning period. in other words, some cycles started at $1,240,000 and then dipped lower, but they all eventually climbed above $1,240,000. You can see this in the attached graph. (I chose that particular starting value because any lower starting value had some final values lower than the starting value.)

This is a long-standing bug in FIRECalc. Any time the lowest ending balance is above the starting balance, it incorrectly reports the starting balance as the lowest ending balance. Unlikely to get fixed as there have been no bug fixes in years, just data updates.

Good question about the average - I don't know how it is calculated.

Yes, this has been reported before, and some have tried to say the text should be changed, rather than acknowledge the bug. But even the suggested change to the text does not resolve it. The $1,240,000 case above gives the best view - $1,240,000 is not the lowest ending value, and it is not the lowest interim point. It incorrectly reports the STARTING VALUE in these cases (where the lowest ending value is > than the starting value.

Good question about the average - I don't know how it is calculated.[

If I'm motivated, I might enter those in https://ficalc.app/ to see what values it provides.

-ERD50
 
Good question about the average - I don't know how it is calculated.[


If I'm motivated, I might enter those in https://ficalc.app/ to see what values it provides.

-ERD50

OK, took a swipe at it, but the delta from the lowest end and the starting point for those cases isn't different enough to make much of a difference anyhow. So, AFAICT, the average seems about right.

-ERD50
 
No scenario that I have ever run for myself has had a value at any time lower than the starting amount, but apparently it can happen, as I see that apparently occurring in the graph you posted.

I don't want to beat a dead horse, but this doesn't even make sense to me.

The whole POINT of Firecalc is to run a hypothetical retirement scenario through all known historical situations. Obviously, some scenarios had retirees starting in 1928, 1986, 1999, 2007, for example. Clearly, even if one's withdrawal rate was a sizable negative value, someone retiring in those years would encounter a portfolio value lower than the starting amount.
 
I suppose that depends on the composition of your portfolio to some extent. I don't recall ever seeing a run with value lower than my starting value, but then I didn't find trying to parse one of the individual lines in that maze to be a useful exercise. My principal concern was to get a 100% success rate, and I did. Even with spending double my actual spending. So I called it a day.

The larger question is why people feel that is an important thing. The goal is simply to get some comfort that one will not run out of money over the period of retirement. If you want to define not running out of money as having at least $500k at all times, then you can set that on the "investigate" tab. It will lower your probability of success accordingly. I think that trying to figure out the precise low is a fool's errand. You're trying to measure with micrometer what you will be cutting with an axe. In the end FIREcalc is a model. There are many models. They are all wrong. Some may be useful. But you will never, ever obtain an exact answer about anything that will occur in the future, no matter what model you use or how finely you parse it.

Ultimately, it concerns me that people will try to slice things too thin (by doing things like calculating the precise low point on that chart and deciding that is safe for them) and will fail in retirement. Give yourself plenty of cushion, no matter what the model says.
 
Last edited:
I guess the more important question to ask the OP is "what are you trying to learn."

OP here. I was using Firecalc as a model, aka a tool, to assist me in deciding when to start taking Social Security. I did not mention this in my original post because I didn't want to derail this discussion into "when should one start taking SS?"

I was keeping our annual spending, portfolio value, number of years, DH's SS and all the other items constant, and then I was plugging in different start dates for my SS and the corresponding annual premiums I would receive, based on the estimates from the SSA website. I was comparing the portfolio trends if I start SS at age 65 (along w Medicare), my FRA, and at age 70. When I compared the results from those runs (all of which resulted in final port. values above the starting amount, yay), that's when I noticed that apparently well-known quirk. I had never noticed it before, but in the past I tended to only look at % success rates. My apologies for beating a dead horse.
 
Last edited:
Originally Posted by Gumby View Post
No scenario that I have ever run for myself has had a value at any time lower than the starting amount, but apparently it can happen, as I see that apparently occurring in the graph you posted.
I don't want to beat a dead horse, but this doesn't even make sense to me.

The whole POINT of Firecalc is to run a hypothetical retirement scenario through all known historical situations. Obviously, some scenarios had retirees starting in 1928, 1986, 1999, 2007, for example. Clearly, even if one's withdrawal rate was a sizable negative value, someone retiring in those years would encounter a portfolio value lower than the starting amount.

I suppose that depends on the composition of your portfolio to some extent. I don't recall ever seeing a run with value lower than my starting value, ...

Not just to some extent, most portfolios have a significant % of equities, and FIRECalc will reflect the history of the large dips that can occur in the first few years of a run. Couple that with even a conservative WR, and the portfolio will be dropping below the starting value. I'd say it's pretty typical.

The larger question is why people feel that is an important thing.

The important thing is that it is a bug. It's telling people something that isn't so, and people should at least be aware of this. If none of those interim year lines matter or are of any interest to anyone, then FIRECalc should just not even display them. But since it does, it should match up, and not create confusion.

Ultimately, it concerns me that people will try to slice things too thin (by doing things like calculating the precise low point on that chart and deciding that is safe for them) and will fail in retirement. Give yourself plenty of cushion, no matter what the model says

I don't disagree, but not everyone is in a position to have such a large cushion, or maybe work has become so mentally or physically difficult for them, or might involve a move, so maybe they really need to understand the pros/cons of retiring with a less "cushy cushion" (time > $$$). So they very well could be interested in what history shows, and be prepared for a scenario similar (or a bit worse) than that.

-ERD50
 
Status
Not open for further replies.
Back
Top Bottom