Historically, what is the recovery time for a market "correction"?

John Montgomery of Bridgeway Capital wrote "Surviving A Bear Market" article which you can find at this link:

How to Survive and Succeed Through a Bear Market | Antler Financial Services

If you look at the chart at the bottom of Page #5 you can see the "Peak to low" and "Low to previous peak" in months of the last several bear markets (excluding the 2008 bear market). I couldn't get the chart to format properly in this post so I provided the link above. Other good information in the article.
 
Interesting question. It turns out that in REAL terms, without dividends, it is not rare (I'm a little surprised). Just eyeballing this graph (Inflation Adjusted S&P 500), depending how you want to define the zigs and zags in between, we're looking at:
  • 1911-1922 (looks like any year from 1911-1915)
  • 1929-1934
  • 1937-1943 (or to 1950)
  • 1966-1981 (again any year from '66 to about '71 qualifies)
  • 2000-2009 (with a dead-cat bounce in the middle - this one is arguable)

So that is about a dozen cases in 4 or 5 bear markets where you are still ~50% down after 5 or more years in real terms. If you don't adjust for inflation most of these drop out, but you are still running out of money if you are in the decumulation stage. S&P 500 Historical Prices

Someone can do a more precise analysis with actual S&P numbers, the "Table" feature shows the actual numbers.

Thank you USGrant1962. Now I was thinking nominal not real and I was thinking dividends re-invested (because I re-invest dividends). At any rate, it gives me some time periods to go back and study.
 
I don't have the research to argue for the others, but 2000-2009 is two bear markets, not one, with a major recovery in between. So rebalancing would have you selling stocks again to buy bonds during part of that period and the portfolio would have increased overall until 2008 (depending on withdrawal rate, AA, etc.).

OK, you were talking in inflation adjusted terms. Yep, the portfolio probably didn't keep up with inflation. But that has no meaning for rebalancing.

We will go through periods where the portfolio does not keep up with inflation. That's just life. Folks like me who do % remaining portfolio withdrawals will just have to live with it. The key is having a high degree of discretionary expenses which means you have the flexibility to belt tighten when required.

Which means to work for a few more years to build a reasonable cushion.
 
Last edited by a moderator:
I don't have the research to argue for the others, but 2000-2009 is two bear markets, not one, with a major recovery in between. So rebalancing would have you selling stocks again to buy bonds during part of that period and the portfolio would have increased overall until 2008 (depending on withdrawal rate, AA, etc.).

OK, you were talking in inflation adjusted terms. Yep, the portfolio probably didn't keep up with inflation. But that has no meaning for rebalancing.

We will go through periods where the portfolio does not keep up with inflation. That's just life. Folks like me who do % remaining portfolio withdrawals will just have to live with it. The key is having a high degree of discretionary expenses which means you have the flexibility to belt tighten when required.

Which means to work for a few more years to build a reasonable cushion.
That's always the tradeoff for retiring early. The earlier you retire, the more discretionary expenses you want to have so you have more wiggle room, or the larger the portfolio you need. If you have mostly fixed expenses, and your portfolio isn't large enough to cover them with a high degree of confidence (lower SWR or high survivability chances, etc.), you're not yet FIRE.
 
Wow so many replies. I’m impressed with the level of record keeping and knowledge on this forum! I’m not sure I’m savvy enough to make a concrete decision now, but I will start shifting my allocation over the next 5 years. I have some dependable fixed income that would sustain me in a downturn but it would be a struggle and I’d have to do a serious downsize. I will definitely put aside a couple of years cash just in case.
 
But in a bear market, stocks are dropping, so any rebalancing is likely by selling off bonds instead, right?

Here's a simple spreadsheet, start at 60/40, stocks drop 10%/year for 7 years. As I mentioned before, a portfolio like this will probably kick off ~ 2.5% divs, so with a moderately conservative WR of 3.5%, only 1% has to be sold, so I keep a steady $10,000 spend, taken only from bonds (no inflation adjustment, keep in today's $). ("$00,000" added to keep things aligned)


Selling off that from bonds isn't enough to keep equities up to 60/40. So you certainly would not sell stocks on the way down.

Even at $30,000 being sold from bonds, an ~ 60/40 is held w/o selling any stocks:


-ERD50

Exactly!!!

But remember that the portfolio recovery time will be extended by keeping the dividends as income instead of reinvesting and drawing exclusively on bonds.
 
Five years into the 2000-2009 timeframe would put you at the year 2005. Considering how great 2003, 2004, and 2005 were, I'd say that if you lost half of everything due to market crashes in that timeframe, then investing might not a good fit for you. Either that, or you have one helluva incompetent/corrupt financial advisor :facepalm:

Now, I'll admit, that when the Great Recession bottomed out, I had given up all of my gains for 2003-2007 (I lost money in 2000-2002). And it was pretty scary, and I started to question my own competence. But, that was just one very specific data point, and I didn't do anything drastic. By the end of 2009, I had actually gained the majority of it back.
 
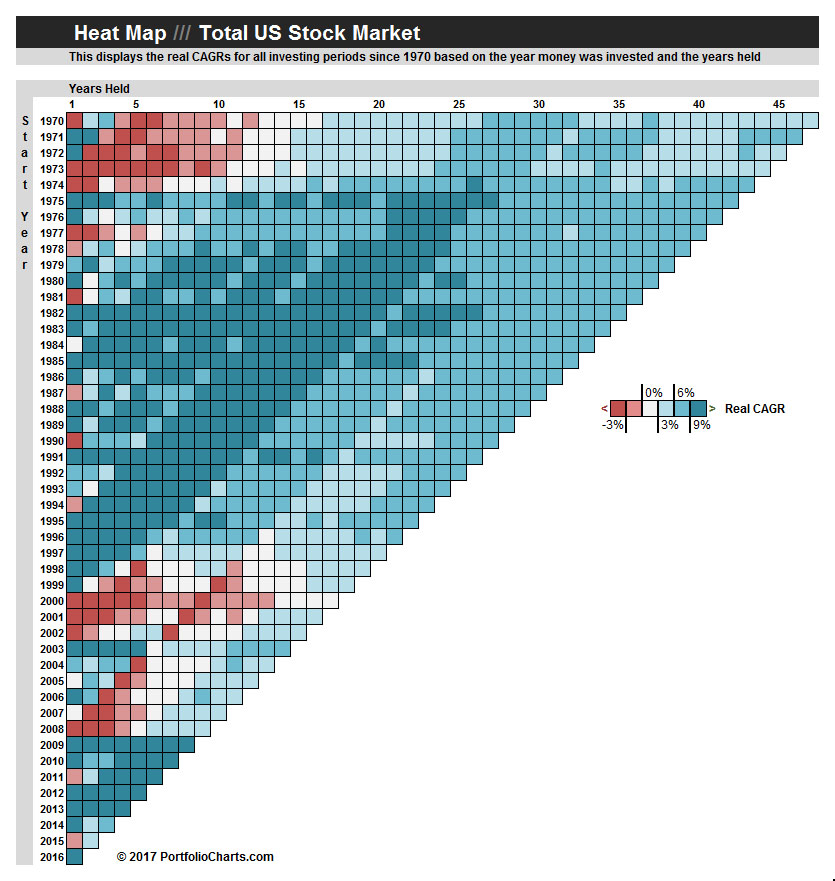
while in nominal returns down turns and flat markets do not seem to last long , the real deal is not nominal returns but real returns .

we have had far longer periods of time before markets recovered once inflation is considered .markets have had poor , flat and down years for a whole lot longer than just nominal returns would indicate . anything not in blue are poor stretches of years where cd's would have out likely performed better over the shorter terms ..

you can see that short term investing in longer term assets really is not such a great idea or as fool proof as just nominal returns make it look .

just going back to 1970 and looking at markets ,actual recovery time in real return , which is all that counts was far greater .

to put things in to perspective , it takes at least a 2% real return over the first 15 years to maintain a 4% draw inflation adjusted over a 30 year retirement and that 2% real return only means you could have 1 dollar left in year 31 so real returns are very important , not just nominal returns .

1970 took 16 years to get a head
1971 12 years
1972 13 years
1973 15 years
1974 11 years
1977 6 years
1978 4 years
1998 5 years
1999 14 years if you exclude just 2 years where things popped up
2000 almost 17 years
2001 12 years
2006 5 years
2007 6 years
2008 5 years .

i-bmHgxCx.jpg


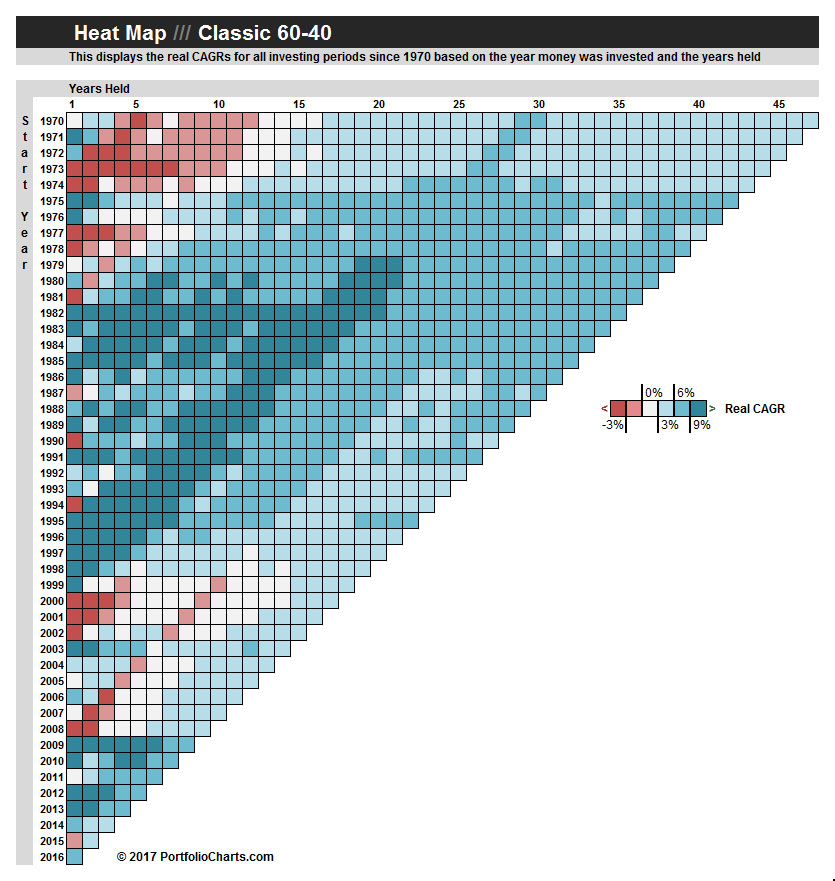
even 60/40 had lots of extended recovery time needed too .

i-ZmDzSvn.jpg


anything not in blue is less than a positive return
 
Those are interesting charts!

Even in 1970 for 60/40, it looks like you don't fall behind until 1973, and then its 9 years to break even and 14 years to go positive again.

Too bad 1966 is not included.
 
they are interesting and they show that while nominal returns in recovery appear to recover pretty quick , real return at times can take many many years.

you always get those who recommend stocks for short term money because recoveries are under 3 years most of the time but they are not that quick in real return and it can be dangerous playing that game . .

Generally speaking, when it takes a long time to recover in real dollars, it is due to high inflation. In such a scenario, if you have a decent percentage of bonds in your portfolio, the damage should be less severe.

I'd be interested in seeing the heat maps for a 60/40 portfolio...
 
the 2nd map down i posted is 60/40.

the opposite was true during the great depression . in dollars you were whole again in 4-1/2 years since the cpi fell 18% . if you went by nominal values you were actually way way a head by the time the same levels were hit as well as it took a long long time to get there .

we did not have high inflation in 2000 and it took almost 17 years going by real return to recover .
 
Last edited:
we did not have high inflation in 2000 and it took almost 17 years going by real return to recover .

The way I read it, it took 13 years, if you were 100% equities. If you were 60/40, it was 4 years.

Look like any color that isn't a shade of read is above 0%.
 
Thanks for that information.
 
The way I read it, it took 13 years, if you were 100% equities. If you were 60/40, it was 4 years.

Look like any color that isn't a shade of read is above 0%.

no , white is 0% , plus is blue , so you would not be a head until you had blue .
 
no , white is 0% , plus is blue , so you would not be a head until you had blue .

I think the legend says white is between 0% and 3%. I won't try to convince you if you disagree.
 
Generally speaking, when it takes a long time to recover in real dollars, it is due to high inflation. In such a scenario, if you have a decent percentage of bonds in your portfolio, the damage should be less severe.

I'd be interested in seeing the heat maps for a 60/40 portfolio...
I don't know about that. Bond funds really get beaten up during periods of high inflation.

Bonds don't help with inflation. You need a large enough stock allocation to beat inflation even though at first stocks will also be hit hard if inflation spikes.
 
The way I read it, it took 13 years, if you were 100% equities. If you were 60/40, it was 4 years.

Look like any color that isn't a shade of red is above 0%.
That's because interest rates were dropping. So bonds helped out big time during the early 2000s.

I agree that white 0% means break even with inflation.
 
but keep in mind that it is not cumulative . so if you had negative real returns for 5 years as an example , a white that is zero will not make you whole again
it only means that one year was even with inflation or maybe a bit better . it will take a red and perhaps quite a few years of reds .
 
I don't know about that. Bond funds really get beaten up during periods of high inflation.

Initally, if rates are rising. If you hold onto them, they recover.

Who wouldn't like to have some 10 year treasuries from the early 80s that were earning over 10%? Or even some 2001 I Bonds earning 6%?
 
that is only if rates fall lower though . historical average bond rates are in the 5-6% range . bonds you own today would get pounded and always be behind the curve if we don't get this low again . .

while it would have been nice to own 13% treasuries , if rates went up and stayed up for decades those bonds would not be a good deal .
 
Last edited:
but keep in mind that it is not cumulative . so if you had negative real returns for 5 years as an example , a white that is zero will not make you whole again
it only means that one year was even with inflation or maybe a bit better . it will take a red and perhaps quite a few years of reds .

I disagree. The wording on the chart indicates it is cumulative. The color of the square isn't the return for that year, but rather the CAGR from the starting time of the portfolio.

So, once you hit non-red, the portfolio is positive for the period from the start to the given square.
 
but keep in mind that it is not cumulative . so if you had negative real returns for 5 years as an example , a white that is zero will not make you whole again
it only means that one year was even with inflation or maybe a bit better . it will take a red and perhaps quite a few years of reds .

Oh, I thought the charts were cumulative. If they are not they aren't telling us anything about real recovery.
 
I disagree. The wording on the chart indicates it is cumulative. The color of the square isn't the return for that year, but rather the CAGR from the starting time of the portfolio.

So, once you hit non-red, the portfolio is positive for the period from the start to the given square.

That's how I was reading them.
 
I was down 27% in late Oct 2008, from the peak in Oct 2007, and regained the '07 peak in May '09.
It was kind of shocking for both the collapse and the recovery to occur that fast--but I had switched most contributions towards stocks to rebalance and also had used some cash and gains in Treasury funds (in fact I reallocated most of the Treasury funds to stocks and other bond funds, including inflation-protected). I had shifted my stock allocation from 90% stocks to 65% in '06 and '07, so I was lucky on many fronts.
If I had been pulling out for retirement, the recovery would have taken much longer (no new contributions and pulling out money to boot), although I was also sitting on cash that I used for rebalancing. I had expected the mortgage market to collapse in '06, like I had seen in Texas/Southwest in the early '80s. It surprised me it took until '08; if the real estate bull had maintained through '09 I'm not sure I would have maintained my skepticism. I suppose that was luck, but it seemed dreadful even when I was more than half-expecting it.
 
Last edited:
Back
Top Bottom