NW-Bound
Give me a museum and I'll fill it. (Picasso) Give me a forum ...
- Joined
- Jul 3, 2008
- Messages
- 35,712
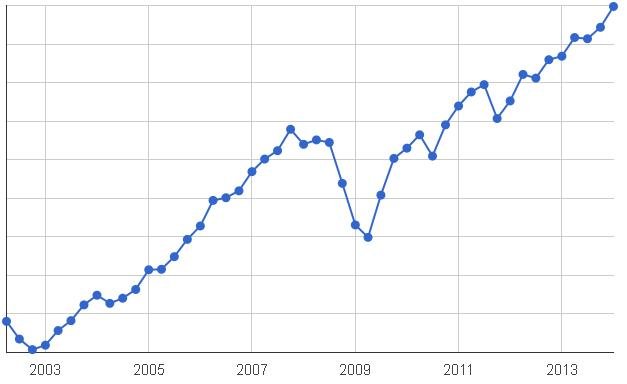
The concurrent threads about market timing reminded me of a promise I made a while back to show what I did during the Great Recession. Though I did dig up the data and made a plot, I then forgot about it until now.
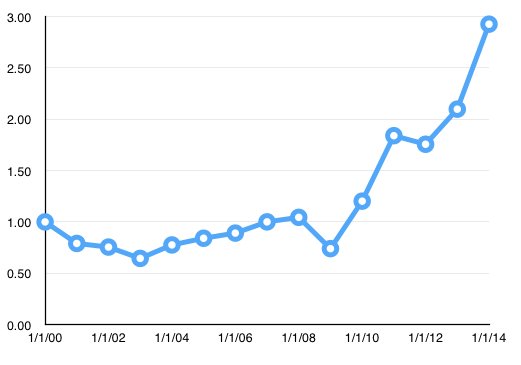
What happened was that from market bottom in Oct 2002 to market top in Oct 2007, my portfolio grew a factor of 2.71x despite the purchase of a 2nd home and not contributing that much to my stash due to part-time work, hence having limited income. Part of the gain was due to some investment in economic-sensitive stocks, particularly the ones feeding off the Chinese economy boom such as the mining industry, solar energy, fertilizer, etc...
When the world economy started to crumble, of course the stocks that went up the most also went down the fastest. If I did not get out of them, I would be in deep doodoo. The Chinese were driving the price of copper up to near $4/lb, and in a matter of a month in late 2008, it dropped to near $1/lb. Yikes!
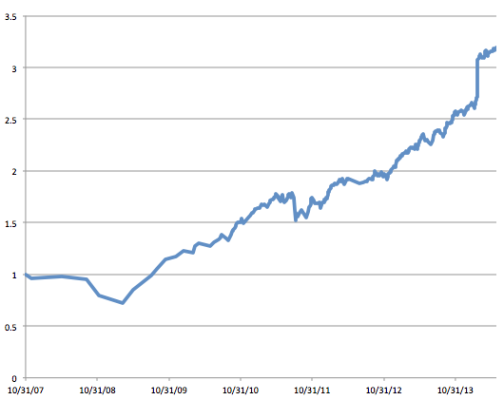
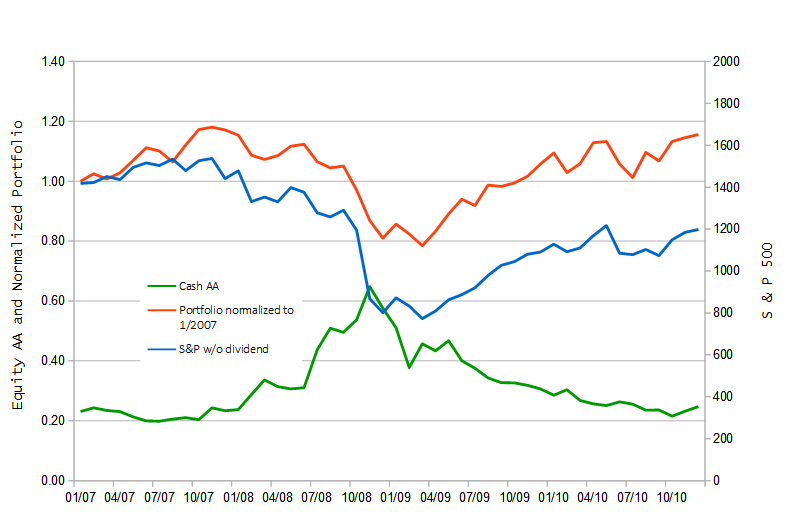
I keep a daily diary of the total of my investable accounts, but the breakdown of the AA is recorded only at the 1st of each month. That record was the basis of the plot that I am showing below.
Looking back, I sold a bit late, but not too late. And then, I bought back right on time. I made "buy, buy, buy" posts back then, which the records still show. My problem was that I then soon started to sell gradually, instead of sitting on it. I would do a lot better if I did not sell out too soon in mid/late 2009. I was worried about a double dip that never came. My AA is normally 75% equities, 5% bonds, and 20% cash. I always like to keep a lot of cash.
I am right now close to 25% cash, 5% bonds, and 70% stocks. This info is for entertainment values only. I am not trying to make any point, other than that a self-proclaimed market timer and stock picker like myself, albeit a chicken one, can survive very well. I say chicken because I never go 100% stock, nor 100% cash.
Flame away!
What happened was that from market bottom in Oct 2002 to market top in Oct 2007, my portfolio grew a factor of 2.71x despite the purchase of a 2nd home and not contributing that much to my stash due to part-time work, hence having limited income. Part of the gain was due to some investment in economic-sensitive stocks, particularly the ones feeding off the Chinese economy boom such as the mining industry, solar energy, fertilizer, etc...
When the world economy started to crumble, of course the stocks that went up the most also went down the fastest. If I did not get out of them, I would be in deep doodoo. The Chinese were driving the price of copper up to near $4/lb, and in a matter of a month in late 2008, it dropped to near $1/lb. Yikes!
I keep a daily diary of the total of my investable accounts, but the breakdown of the AA is recorded only at the 1st of each month. That record was the basis of the plot that I am showing below.
Looking back, I sold a bit late, but not too late. And then, I bought back right on time. I made "buy, buy, buy" posts back then, which the records still show. My problem was that I then soon started to sell gradually, instead of sitting on it. I would do a lot better if I did not sell out too soon in mid/late 2009. I was worried about a double dip that never came. My AA is normally 75% equities, 5% bonds, and 20% cash. I always like to keep a lot of cash.
I am right now close to 25% cash, 5% bonds, and 70% stocks. This info is for entertainment values only. I am not trying to make any point, other than that a self-proclaimed market timer and stock picker like myself, albeit a chicken one, can survive very well. I say chicken because I never go 100% stock, nor 100% cash.
Flame away!

Last edited: