Fermion
Give me a museum and I'll fill it. (Picasso) Give me a forum ...
That's the fundamental problem...we won't know til after we've gotten there!
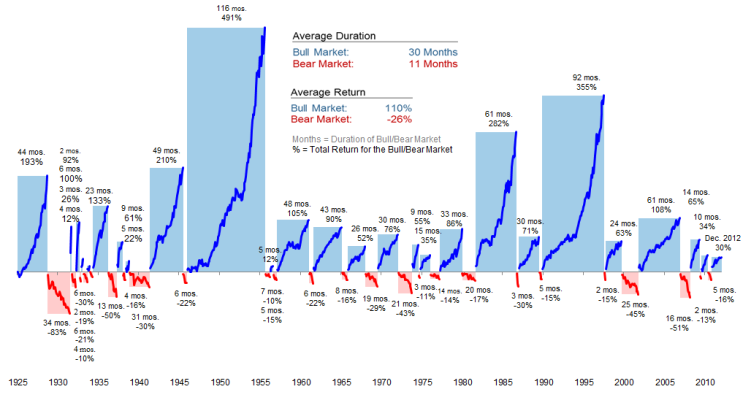
I would say we are at 16 or 17 on that chart. +/- 10
That's the fundamental problem...we won't know til after we've gotten there!
This bull market could run quite a bit more if we hit those numbers reached in 2000. DOW 30,000 anyone?


True.Besides the fact that the stock market is at all time highs, what is causing you (those who commented above) to think that a crash or correction is likely? Or is that the main reason?Because a correction is always likely? It'll happen, just a matter of when.
How many bear markets have their been since 1995? At most 5? In which case a new high alone was a predictor 5 of 432 times...IOW uncorrelated.Although U.S. equity markets (represented by the Russell 1000® Index) are at or near all-time highs, that doesn’t necessarily indicate they’ve peaked. Since January 1995, the U.S. equity market has seen 432 new daily highs and has eventually moved higher after each one.
I would say we are at 16 or 17 on that chart. +/- 10
That's the fundamental problem...we won't know til after we've gotten there!
Yeah, that's about how I feel. While I still have my 401k contributions on auto pilot, and continue to reinvest dividends from my Scottrade account, I'm starting to wonder if it's time to take a little profit out and buy on the next dip.
Of course, who knows when that next dip will be? I'm pretty good at predicting them. About half the time.
Well, the market does not really make a new high if we account for inflation.
From Jan 2000 till May 2014, the market has to advance 1.41X to match inflation. Yes, there's a bitty dividend that helps, but it is not enough. The S&P reached 1,500 in March 2000. That's equivalent to 2,100 now, but the S&P is only at 1,972 at this posting.
There's really not much to get excited about.
And while I post this, my Quicken screen is counting the money in the other window of this laptop. I will take what the market gives me, with the understanding that tomorrow it may be all taken back, and some.
IMOThis bull market could run quite a bit more if we hit those numbers reached in 2000. DOW 30,000 anyone?
The index was pushed out of the red with the recent surge. Still, that return does not support the WR that most retirees count on. And they have to suffer through two scary roller coasters in those 14 years.I think we are looking at 23.117 after inflation return from June 2010 till June 2014. Or real annual return of 1.497% after inflation with dividends reinvested.
This is not great but inflation did not eat up your money. In fact you made a bit of money.
If you started in June 1983 - June 2014 you would look at 7.772% real return. That is pretty good return
If you invested also into mid caps and small caps and international indexes you would be looking at better returns in both time periods.
Clearly, we are at 17! LOL!Help, I'm lost. Where are we?
Now you've done it.I am not W2R. However...
WHEEEE!!!!
+10!
(but you forgot the dancing icons)
Yeah, I did our quarterly review and our net worth has also set another record high, even though I retired 3 years ago. Life is good, and it still will be whenever the inevitable correction comes, hopefully it won't be too severe.I am not W2R. However...
WHEEEE!!!!
There must be a reason people don't count that intraday event. Was it a flash crash? Regardless, there is probably some criteria involving closing prices.I pose this question because in October of 2011 the S and P 500 hit what was technically a sum total 20% intraday downturn from the previous high ,labeling it a bear market.The Dow and Nasdaq in 2011 fared better,but after the 2008-2009 bear market it seemed overkill to have another sharp drop so soon in time.So if the Bull market didn't really start until after October of 2011 this makes it only roughly 2.75 years old and not 5 years into the Bull market.If this is true,and I am only supposing ,then maybe this helps to explain the lack of a 10% correction.We had a nice 6% correction in the SP500 some months ago and nice correction in biotechs in the Nasdaq earlier this year. If my theory is correct maybe,just maybe this Bull Market is not so long in the tooth as was thought.This doesn't mean we won't have a nice correction at some point soon,but I think we may be in better shape than was previously thought.What does everyone else think?
There must be a reason people don't count that intraday event. Was it a flash crash? Regardless, there is probably some criteria involving closing prices.
We've also gone quite a few years without a 10% correction - more like 5 or 6% here and there.
I am not W2R. However...
WHEEEE!!!!

I know!!!
Today was yet ANOTHER all time high in net worth, for me. It seems like I have been reaching a new all time high net worth about once a week all year. I could get used to this!
There must be a reason people don't count that intraday event. Was it a flash crash? Regardless, there is probably some criteria involving closing prices.
We've also gone quite a few years without a 10% correction - more like 5 or 6% here and there.
I just pulled up my spreadsheet, and it doesn't show anything major happening around the October 2011 timeframe. Now, I only have month-end data, so if something major did happen earlier in the month, my records aren't going to show it. But if anything happened, I bounced back from it pretty quick.
FWIW, my investible assets around that timeframe were...
09/30/11: $585K
10/31/11: $642K (so apparently something good happened that month!)
11/30/11: $642K.
As for "flash crash", I googled it, and that event was on May 6, 2010. I had totally forgotten about it. But, that era was my last experience with three down months in a row. They went as follows...
4/23/10: $573K (my peak for the month, and a new high)
5/20/10: $503K (in those days, I'd only keep track of the month's high if it was a record, or the low if it was severe enough)
6/30/10: $496K (that month's low)
7/02/10: $492K (that month's low)
8/9/10: $507K (that month's high).
Now, if I was recording last day of the month back then, who knows...the results might not have looked that bad. Considering July bottomed out on the second day, there's a good chance I may have been above $496k later in the month. But, for whatever reason, I obsessed with those peaks and valleys more, and didn't change to last day of the month until 9/30/11.