Kind of like the “perfect” portfolio

Jerry1

Give me a museum and I'll fill it. (Picasso) Give me a forum ...
Site Team
Joined
Nov 27, 2014
Messages
9,251
Was reading this article:

https://www.barrons.com/articles/re...vesting-savings-51673038954?mod=Searchresults

Note - It looks like the article is behind a paywall, but I just closed the subscribe window and it let me read it.


And wondered what y’all think. It’s a lot like the “perfect” portfolio but has seven components rather than 4.

From the article:

It consists simply of splitting your investment portfolio into 7 equal amounts, and investing one apiece in U.S. large-company stocks (the S&P 500SPX +2.28% ), U.S. small-company stocks (the Russell 2000RUT +2.26% ), developed international stocks (the Europe, Australasia and Far East or EAFE index990300 +1.75% ), gold, commodities, U.S. real-estate investment trusts or REITS, and 10 year Treasury bonds.

It’s beaten the standard Wall Street portfolio of 60% U.S. stocks and 40% bonds. Not just last year, when it beat them by an astonishing 7 percentage points, but for half a century.
 
I read the article and found it interesting.

Not sure it is something to adopt, but maybe on a small scale.
 
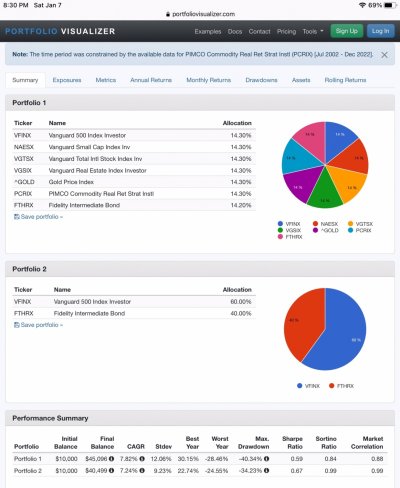
Interesting. Here’s my best attempt to model it on Portfolio Visualizer, though there’s plenty to quibble about with my available funds choices. Still, I was able to get a 20 year look at a similar allocation. The huge caveat is that these projections do not include fees, expense ratios or taxes. I suspect strongly that a simple 60/40 index fund portfolio would outperform if inclusive of costs.
 

Attachments

  • IMG_0701.jpg
    IMG_0701.jpg
    359.4 KB · Views: 135
Last edited:
"Gold bugs" who love gold always include performance from the 1970s, which is why this portfolio mentions 50 years. The U.S. transitioned off the gold standard then, causing gold to 5x in a decade - really nice for rebalancing, even if the spike didn't last.

Gold Prices - 100 Year Historical Chart
 
Last edited:
In my humble opinion the perfect portfolio does not exist, as a definition for perfect does not exist.
Reasoning: If it were possible to beat the market consistently, then the beat would become the market!

Indices and Benchmarks also experience life cycles. Bad indices are shutting down.
New benchmarks are taking over in relevance.
For about 30 years German DAX consisted of 30 stocks. Now it contains 40 stocks.
Back-tracing is a great Skill for Graduates to land an IB Job, but it won't say much about future performance.

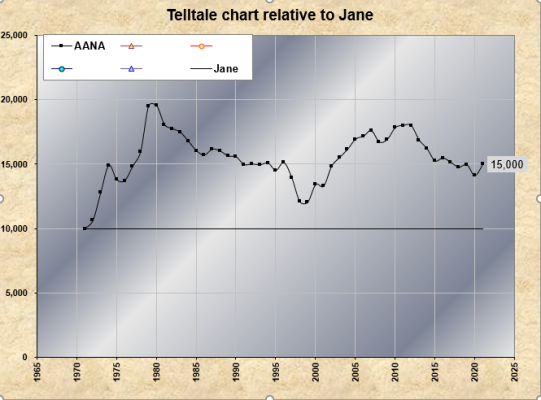
Exactly. I recreated a backtest using the Simba Spreadsheet over on Bogleheads. I created a Tell-Tale chart the compares the cumulative returns of this portfolio vs. a portfolio comprised of the asset classes available on Simba with a fairly Plain Jane 60/40 portfolio that Fidelity often recommends comprised of:
42% US Total Markets
18% Total International (ex US)
35% Total US Bond
5% T-Bills

A tell-tale chart is the cumulative returns of one portfolio divided by the cumulative returns of another from the beginning of the backtest to a given point in time. A general positive slope over a long period indicates outperformance and a general negative slope indicates underperformance.

This outperforms significantly (steep positive slope) till about 1980, then steadily underperforms until 1996 when it then significantly underperforms till about 2000 or so. Then another around of outperformance (not quite as significant at the 70's) till 2012 or so. Since then, it's been in a general underperformance mode, except for the last 2 years or so which is too early to say whether it's an outperformance trend starting again or not.

Anyway, during the 70's it did gangbusters and this is where it got all of its outperformance that the article notes. Given commodities and gold holdings, that isn't too surprising. But it also had very long periods of underperformance as well. See attachment. If you had jumped on this in 1980 instead of 1972, you'd not be very happy. Just imagine the entire curve shifted downward by moving the 1980 point to $10K. This portfolio may appeal to some, but it hasn't consistently outperformed more standard portfolios over time periods that many investors would be interested in.

See attached: Note that the backtest starts in 1972 which is limited by data availability of one of the assets. And it ends in 2021 as the 2022 version of Simba hasn't been released yet.
 

Attachments

  • Pic.png
    Pic.png
    279 KB · Views: 62
Last edited:
Your Tell-Tale chart provides an interesting look at a static model's performance. I'd be interested to know why this model was 'steadily under-performing' in the 1980 - 1996 Bull Market Run. Or why some of the other time frame performances appear to defy what was actually happening in the markets.

I think my take-away is this -- There is no Perfect Portfolio over an extended time frame. You can't just set it, and forget it. An Investor has to be cognizant of Market Turning Points and be nimble enough to make the moves that count.

Or just be happy with a good plan instead of a perfect one. A good one allows them to reach all of their planning goals with a minimal amount of effort.
 
If you're in search of a model portfolio, here are a bunch: https://portfolioslab.com/lazy-portfolios

Portfolio Visualyzer has many tools also: https://www.portfoliovisualizer.com/examples

Once you settle on asset allocation (how much risk do you want?), pick a model that can be sliced up into your various accounts (tax-deferred, tax-free, taxable) with little effort.

Spouse and I have been discussing these things. We have 7 investment accounts with 2-3 funds in each). We're consolidating further each year.

Son-in-law is also asking about his inherited IRA, under the expert guidance of paid advisor. It managed to perform worse than S&P 500, with 9 funds (65% equity). With 9 funds, I can see he is very confused.

I've only been evaluating posts and advice for say 15 years. Some have far better advice. But one caveat, is that if you want to rebalance, it gets tricky with multiple accounts and funds. So you have to evaluate 7-fund solution in that light.

Also keep in mind that predicting the next 10-20 years (may be the most important ones to you) is not possibile.
 
That tell-tale chart is a good way to analyze this situation.

I agree that any static portfolio will have bad relative times and might well test the patience of any investor. How many people stick with a plan for even 10 years? Not me unless the plan includes a non-static method.

That is why I set up a trend following method in retirement accounts that gently moves between asset classes. Example: probably international funds will have a good relative year at some point and I hope to catch a good percentage of that move but will be in US funds until then (right now in large value).

Of course trends change and that is the rub. They can last for a few months or a few years. Too many moving parts to correctly pick inflection points.
 
My favorite “lazy” portfolio author is Scott Burns. He has a few different models, but all have the same underlying principle: costs matter. Similar to the original post, his models outperform managed portfolios the vast majority of the time.
 
I agree that any static portfolio will have bad relative times and might well test the patience of any investor. How many people stick with a plan for even 10 years? .


Truth. Some of these asset classes need 20 years to cycle.
 
Back
Top Bottom