Noisy spending data

corn18

Thinks s/he gets paid by the post
Joined
Aug 30, 2015
Messages
1,890
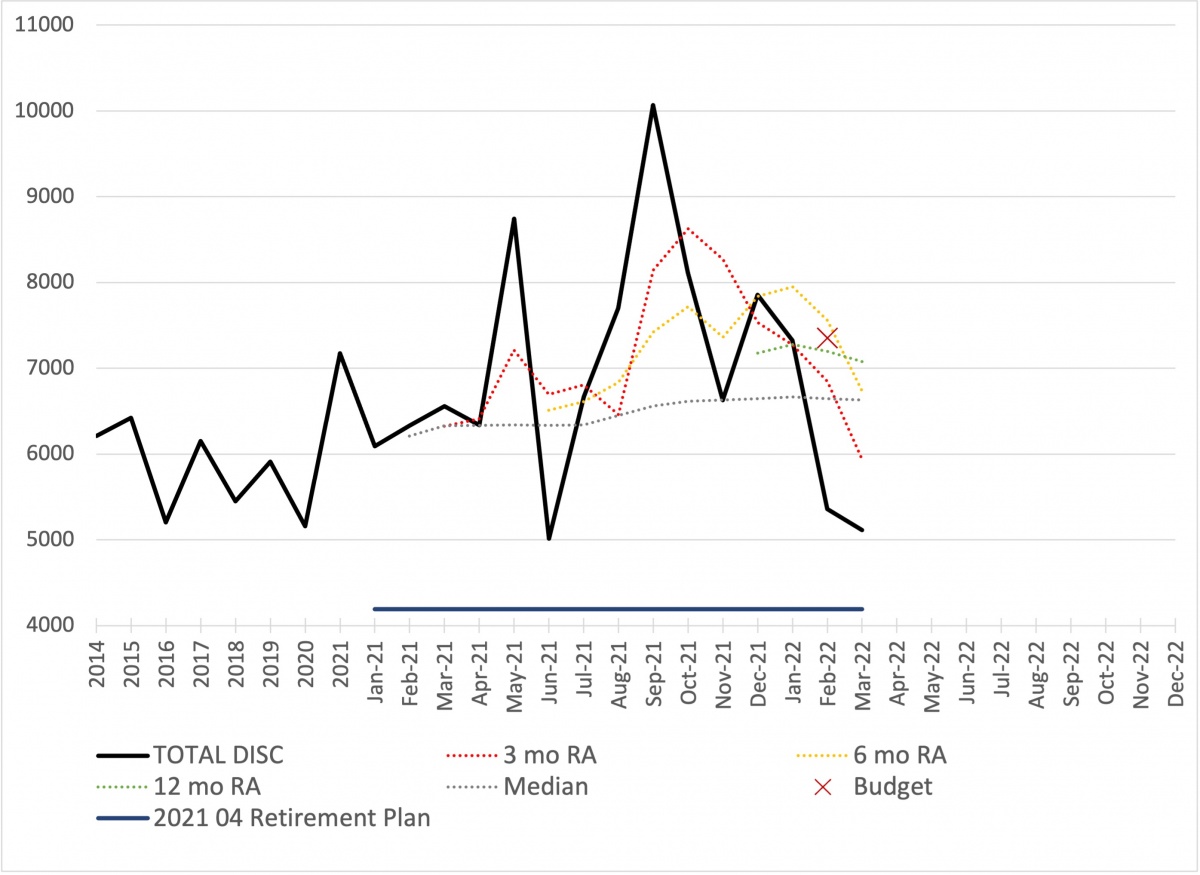
Retired last year @ 55. We didn't follow a budget this past year, just spent what we wanted. Now that I have a year's worth of data, I am trying to figure out what to do with it for planning the next 40 years. I had a number I used to decide to retire, but it was all wrong.

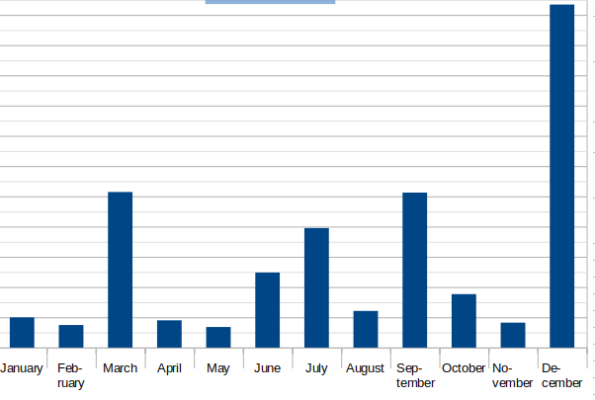
The only noisy data is what I categorize as our discretionary spending. It's the wrong label for what it includes, but it's what I have used for 20 years. Here's what's in the noisy data:

Auto
Fuel
Clothes
Pets
Food
Dining
Gifts
Health / Beauty
House
Entertainment
Misc

The nosiest is Auto (new tires, maint), pets (ER visits, got a puppy) and house (bought a new house last year and now filling it up with stuff).

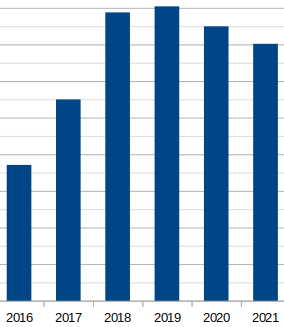
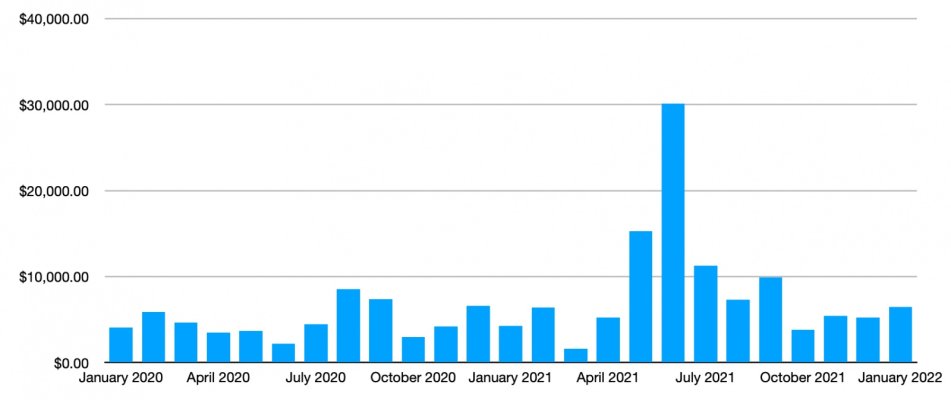
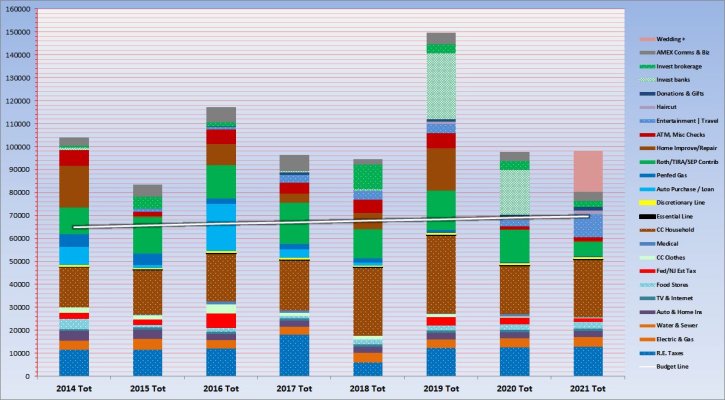
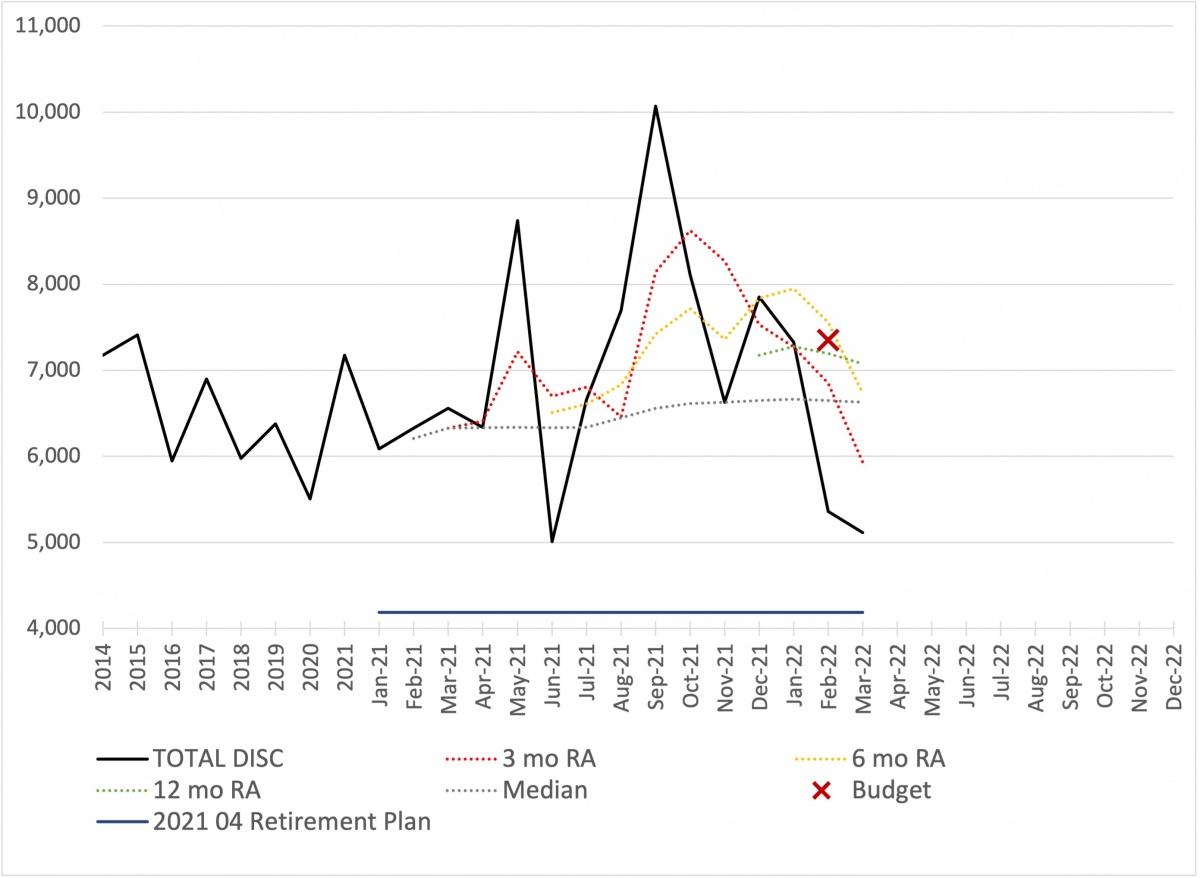
Here's what the data show:

35183-albums227-picture2564.jpg


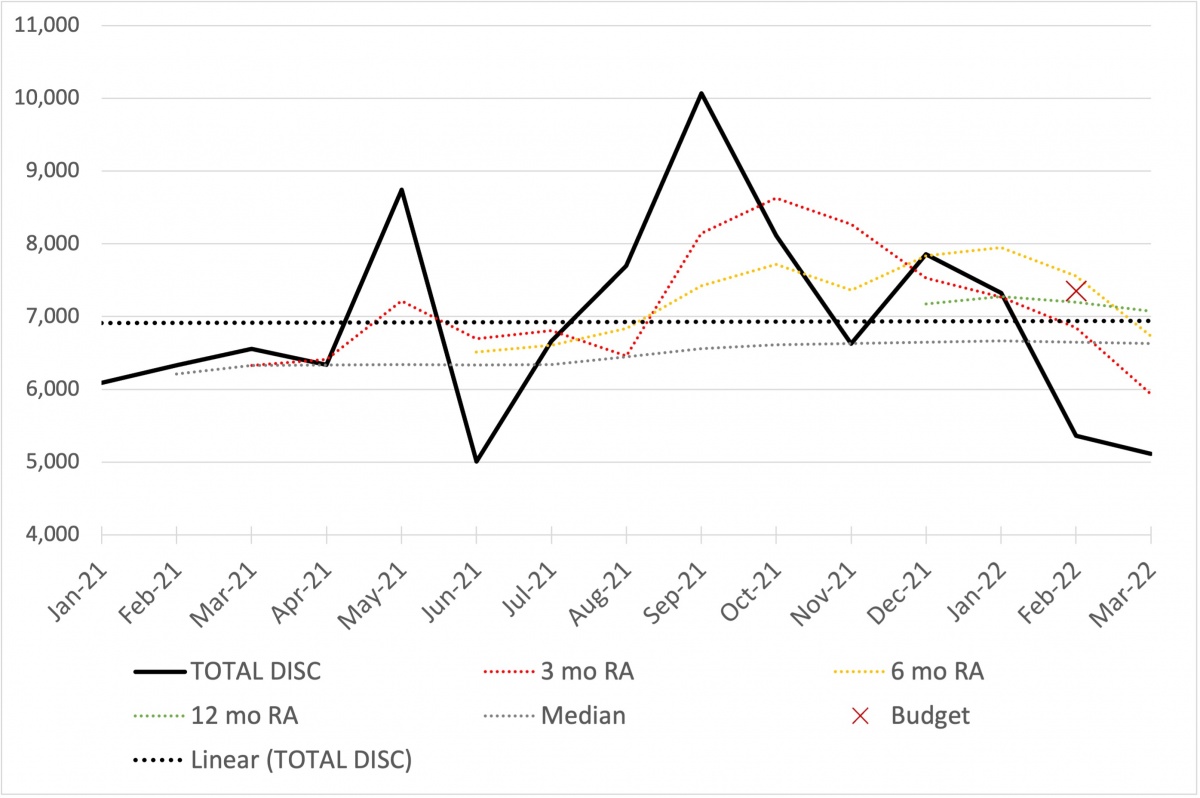
For future planning, I am using the red X on the right. Seems like as good a guess as any.

What do you think?
 
Last edited:
Looks fine to me, but it's your life ;-)

I personally use a 6 month rolling average on my total spending and use that to calculate a WR% which I monitor.

Since I've been watching that rolling average for a number of years, I know it fluctuates a bit due because I have property taxes and Christmas both in December and both of those are relatively large lumpy expenses.

If you include your nondiscretionary expenses in your graph, you should see that the variation on a percentage basis is lower. That thought might make you feel better.

Also, hopefully you have some margin in your plan to whatever comfort level you like.
 
I just track what is spent by me. DW tracks some of hers separately.

The variation in a year is great, but per year it is a lot smoother, you will notice I learned to spend more after 2016 :LOL:
 

Attachments

  • Spend for 2021 by month.png
    Spend for 2021 by month.png
    12.1 KB · Views: 94
  • Spend for past 6 years.png
    Spend for past 6 years.png
    5.9 KB · Views: 410
I retired earlier than you did, and have been retired for 20 years now. At the end of each year, I totaled our expenses, even made pie charts of expenditures in different bucket categories (one pie per year). Every year, I also added another bar (histogram style) to my expense per year chart. After a bit, I had to deal with infrequent larger expenses, which would make the bar chart bounce up and down. So I kept a running total each year of "unusual" expenses, be they medical, new vehicle, etc. At the end of each year, I would review and decide which items were really "unusual" that year, in a financial sense. Things like a root canal and cap, though I have only had 3 over the years, I deemed not $$ enough to be "unusual". A brand-new vehicle was.

I adjusted my bar chart some years to add a parallel bar entry. For example, let's say 2010 was a new vehicle. So year 2010 would have two vertical bars - 2010, and 2010b. One bar would be the total expense, the other bar would be total expense minus the deemed "unusual" expense. So at a glance it was easy to see what the overall flow of expenses were as the years went buy. Can ignore the "unusual", or see how often and how much the "unusuals" were.

As the years went by, the per-year pie chart of expenses was the first to fall by the wayside. And it's been about 5 years since I've added to the per-year bar chart. I DO continue to keep track of yearly expenses, but I've reached the point in the EER-->ER-->Okay-we're-elderly-people-now continuum where it really doesn't matter anymore. We're DIY people, far from big spenders, and we really haven't changed. The personal characteristics that allowed an Early-Early Retirement experiment live on.

Please do not take this to suggest that collecting data and analyzing it is worthless. To us it was not, it was a part of seeing where we were/are, and increased our confidence that the experiment would succeed.

It clearly showed certain major financial mileposts for us... like the University graduations of each of our kids, which lightened the financial load greatly. On that I am reminded of the Wallace and Grommet movie where they are strapped in the rocket, ready to blast off to the moon. They're on the launchpad, rocket engines are at full thrust, the rocket is shaking, but no go... suddenly, Grommet realized the PARKING BRAKE was still ON, and releases it, and they zoom off :LOL:
 
I record the total spending in each month from the credit cards and checking account payments. I am only interested in the total amounts each year, accurate to the next $5,000.
 
If you look at discretionary data month-to-month, of course it is going to be noisy.

Even if you look at it year-to-year, it will still be noisy. Maybe in one year, you bought a car and paid cash. Or maybe one year you paid for your daughter's wedding.

You made me curious, and I looked up Quicken to get my annual expenses. It only went back to 2011 when I started to track expenses. And for kicks, I also adjusted for inflation to have something more meaningful. Then, I normalized every year to 2011 which is the baseline.

2011 1.00
2012 0.72
2013 0.72
2014 0.90
2015 0.97
2016 0.72
2017 0.64
2018 0.64
2019 0.61
2020 0.47
2021 0.54

There are big varations from year to year, but the numbers generally go down, just like Bernicke warned.

One thing I found alarming in this exercise is that from 2011 to 2017, the cumulative inflation was a mere 8.5%. Then, it jumped that much in one year recently. Not good!
 
Last edited:
I tracked category spending for about 20 years. It was fairly consistent with the exception of big ticket items, such as cars, home remodeling, etc. It gave me a comprehensive look at what expenses should be going forward.

8 years into retirement, I still categorize my expenses. But I rarely look at the data by category. I primarily look now at total spending by month. If something looks amuck, I then take a look at category spending. My monthly graph shows some inequities in May, June, July and September, 2021. Digging into it, May was income tax, June was new vehicle, and July and September were real estate tax months. Aside from these expenses, total monthly expenses are fairly consistent and similar to past spending.

For me, tracking category spending is fine, but total spending analysis is more important. I just try to keep total spending (not including taxes and big ticket items) to around historical $5k per month. I can control total spending somewhat by limiting discretionary spending.

We don't plan ahead for big ticket items (cars and remodeling), so these things take my spreadsheet somewhat by surprise. I pay for these out of a cash account.
 

Attachments

  • Screen Shot 2022-03-27 at 5.20.13 AM.jpg
    Screen Shot 2022-03-27 at 5.20.13 AM.jpg
    128.8 KB · Views: 60
95% of our transactions (+/-) go into the burn rate, which I adjust annually. The burn rate is the planning number that I use to manage cash flow. I have a spreadsheet with a column for each month. At the top of each column is the month start balance of spending accounts. Subtracted from that is the burn rate and individual planned or actual lumpy expenses, like a car, or big transactions that aren't in the burn rate calculation. Also in the column are any transfers from the portfolio. So the sum of the column is the month-end cash accounts balance. I collect spending data just to feed the average burn rate so I can plan the cash balance, but don't "budget" with the data.
 
We've never been budget-conscious. But in anticipation of retirement I did start totalling various spending categories, to answer the question for retirement calculator, "What is your annual spending in retirement?"

Some categories are small, a little difficult to see, but the secondary purpose was to find what is truly discretionary. So, for us bumpiness in a particular category is not concerning. YMMV.
 

Attachments

  • Clipboard01.jpg
    Clipboard01.jpg
    159.6 KB · Views: 79
Corn18

one year doesn't give you that much info... sometimes people are either ramping up (for later higher burn, eg. travel, etc) or are doing deferred maintenance items that they didn't have time for until retirement

Spouse examines spending on monthly basis...but unless it's really out of ordinary (this year it was heating costs... ended up having HVAC repair) it's more "situational awareness"
we planned on burn based on worst previous five year period...plus 25%... and only when we bought a new truck and a used trailer did we even approach that burn
Now, change in investments is another matter; with anticipated start of SS next year it will be more fuel for the burn pile, and less need to be as concerned about where investments are heading (we planned on a max of 3.5% and usually are below 2% wr)
 
I updated the data going back to 2014. I also added a line that shows what I used to decide to retire (that bottom line). I cannot for the life of me decipher why I picked that to decide to retire. It is not based on any data. Weird.

These expenses do not include buying a car, taxes, or other really big lumpy stuff. That has it's own budget. It is interesting to see the increase when we retired. We went nuts last year, mostly because my severance package was ginormous. It looks like we may settle into a $60k / year budget for these items once we get the new house settled in.

35183-albums227-picture2565.jpg
 
Noisy spending data is rather normal for some of us who travel a fair amount, especially in retirement.

I'm starting year ten of retirement now and I've never found the need to track or categorize my spending. I have excess retirement income coming in most months without having to withdraw from my portfolio.
So I just keep a decent amount in my checking account and keep an eye on upcoming travel expenses.

An exception, of course, will be made for the new car I'm getting close to pulling the trigger on. I'll be withdrawing $40k or so from the accumulated excess in my taxable account to buy that...
 
To reiterate, I track lumpy stuff like cars and taxes separately. They are very predictable. So is what I call my non-discretionary spend:

Home/Auto/Umbrella Insurance
Life Insurance
Medical
Health Insurance
Cell Phone
Internet
Utilities

These are flat as a pancake.

I also have a separate line for Blow That Dough (BTD). That is for travel, large home improvements or whatever else we decide to blow money on.

The issue I am trying to nail down a bit better is this base discretionary spending. Picking $10k / mo for 40 years has a huge impact vs. picking $6k / mo.
 
I updated the data going back to 2014. I also added a line that shows what I used to decide to retire (that bottom line). I cannot for the life of me decipher why I picked that to decide to retire. It is not based on any data. Weird.

These expenses do not include buying a car, taxes, or other really big lumpy stuff. That has it's own budget. It is interesting to see the increase when we retired. We went nuts last year, mostly because my severance package was ginormous. It looks like we may settle into a $60k / year budget for these items once we get the new house settled in.

35183-albums227-picture2565.jpg


Using a 12-month rolling average is better if your expenses fluctuate a lot. You put the X well above the average, so it looks OK.

By continuing to track these numbers, you will see if you start to encroach on that X, and know to hold back on spending.

Many posters here, myself included, underspend the 4% WR significantly, and with a large safety margin we do not have to watch that close.
 
Our budget is a rolling one, at the beginning of the year I add a lump sum into various buckets and rollover any remaining money, so as long as a whole we are positive, we are good.

So like Auto we budget $2k/yr for repairs/maintenance but we had $1030 leftover from last year so its now $3.030.

Big ticket replacement items (cars/appliances,etc) are grouped into a reserve budget which we add $4,125 to each year. We have enough in there now to replace our one car which we will likely delay until next year due to the price spike.

If we were ever short it would come out of the discretionary budget and that wouldn't be replaced. I've been tracking expenses for 25 years in Quicken, expenses are very lumpy month to month and even year to year but overall the rolling budget averages it out.
 
To reiterate, I track.......


  1. lumpy stuff ....
  2. my non-discretionary spend....
  3. Blow That Dough (BTD)......
  4. The issue is this base discretionary spending....


You track 4 different types of expenses, but by separating them out, some are going to be extremely variable per month or per year, so harder to average out without many years of data and accounting for inflation plus lifestyle inflation (+/-).


This would not work for me, as my nature would be, when I had lots of lumpy expenses like buying a car or two in 1 year, I'd naturally pull back from more large expenses.


Whatever number you pick right now, $6K or $7K per month <FIXED>, does not have to remain that way, after a couple more years maybe you raise it or even lower it depending upon how the spending has been in the other 3 types of expenses.
 
Last edited:
You track 4 different types of expenses, but by separating them out, some are going to be extremely variable per month or per year, so harder to average out without many years of data and accounting for inflation plus lifestyle inflation (+/-).


This would not work for me, as my nature would be, when I had lots of lumpy expenses like buying a car or two in 1 year, I'd naturally pull back from more large expenses.


Whatever number you pick right now, $6K or $7K per year, does not have to remain that way, after a couple more years maybe you raise it or even lower it depending upon how the spending has been in the other 3 types of expenses.

I am thinking along the same lines. I will keep using the 12mo rolling average for these expenses.
 
You track 4 different types of expenses, but by separating them out, some are going to be extremely variable per month or per year, so harder to average out without many years of data and accounting for inflation plus lifestyle inflation (+/-).

This would not work for me, as my nature would be, when I had lots of lumpy expenses like buying a car or two in 1 year, I'd naturally pull back from more large expenses.

Whatever number you pick right now, $6K or $7K per year, does not have to remain that way, after a couple more years maybe you raise it or even lower it depending upon how the spending has been in the other 3 types of expenses.

Corn18 was talking about $6K-10K per month, not per year.

I think that if you consistently spend no less than $5K/month on this category, then perhaps the $5K becomes one of the essential part of the life style. It is no longer discretionary if you could not help it.
 
I reran the data adjusted for inflation (2021 dollars). And @NW-Bound is correct, this is monthly spend.

35183-albums227-picture2566.jpg
 
I track net worth minus real estate quarterly. If annual trends ever look negative, I will pay closer attention to spending. Other than that all I do is ensure there is enough cushion in the checking account for lumpy expenses like property taxes, insurance, quarterly taxes, new cars, traveling or gifts to our kids. Everything else is smooth and predictable and we really don’t splurge much.
 
Many posters here, myself included, underspend the 4% WR significantly, and with a large safety margin we do not have to watch that close.
+1

I generally buy whatever I want/need, but I don't want/need much so I also generally underspend even for a 1% WR.

I also keep track of what I spend, to the penny, every day, and run projections of my spending for the year. If my spending ever started to become unusually high I'd put the brakes on!! :LOL: But so far, so good. Right now, my projected 2022 spending is a little under 2%. That's higher than usual for me but I'm fine with it. In fact I'd like to spend a little more maybe.
 
At the end of the year, I estimate what we will spend during the new year by filling in a spreadsheet that has 20 or so categories.......health ins, auto gasoline, HOA fee, estimated taxes, dining out, etc and a misc category based on a WAG. I populate this database with known costs and estimates and total it and compare it to income - (SS) and RMDS. Usually it is a plus on the income side. If not, I know we will be adding funds from some other account

Then I have another spreadsheet that tracks monthly spending buy accounts (Chase checking, VISA, Other CC) and all I do is list the monthly total spend of each account (three numbers). I don't track details at all as it is of no value to me if we spent $250 on gasoline versus $275.50 that month.

At the end of the year, I can see if we spent more or less than I anticipated. If we spent more, I can go back to the month or months where we went higher and see what went high.

If we spent less, than all is OK. Then I start all over again. :)

Unanticipated lumpy expenses are just that - Lumpy!
 
Last edited:
I generally buy whatever I want/need, but I don't want/need much so I also generally underspend even for a 1% WR.

I also keep track of what I spend, to the penny, every day, and run projections of my spending for the year. If my spending ever started to become unusually high I'd put the brakes on!! :LOL: But so far, so good. Right now, my projected 2022 spending is a little under 2%. That's higher than usual for me but I'm fine with it. In fact I'd like to spend a little more maybe.


I am greedy and want a lot, but most of these are way too expensive. :)

The things that I can easily afford, I don't want them that much, such as a bigger TV, a faster PC, etc...

About tracking expenses, Quicken does it for me to the penny. However, it only displays amounts to the dollar. :) And then, charges I put on my bank cards don't get posted for Quicken to download until a few days later. This is OK too.


PS. About planning expenses, I don't do that and simply assume that I will be on the same trajectory as the past 12 months. Quicken tells me what my expenses were for the 12 trailing months. If I need to make a big purchase, I will know then.
 
Last edited:
Back
Top Bottom