Retirement Planning Spreadsheets with a Tax Bracket Warning

My usual approach, to use the previous year tax software to plan the current year, won't work as well this time, as the rules have changed more than usual. Of course the last minute planning I do in late November will work... I'll have the 2018 tax software by then. That's the time of year I take actions that make a difference anyway.

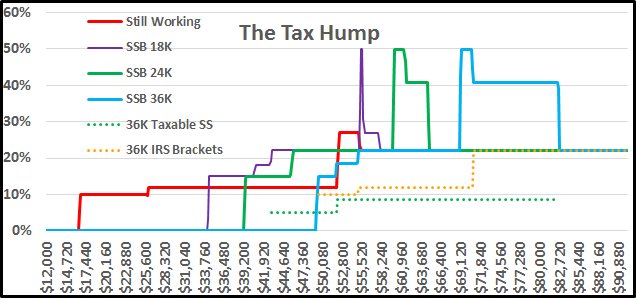
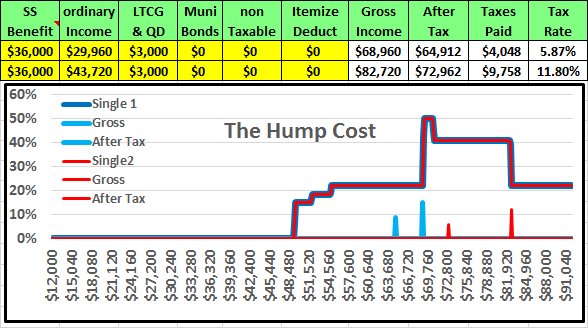
Rather than getting a spreadsheet developed with all the right formulas, I just do some what if trials in the tax software. This allows me to generate a hump diagram. Sometimes it makes sense to stay on the cheaper side of the hump, and other times when wanting to avoid the RMD torpedo, it makes sense to power through the hump and get as much as you can through the gauntlet before hitting the next marginal rate increase.

A couple of years ago I found a huge and complicated spreadsheet that did Federal taxes. It was locked so I couldn't delete the stuff I didn't need, and couldn't see how it worked, so I never really used it. My plan at the time was to eliminate everything except that which applied to me, simplifying a bunch, then have a much faster way to map the humps. But resorted to iterating tax software.
 
Worrying about marginal tax rates didn't make sense to me either as a young CPA. I kept thinking in terms of averages. However, marginal tax rates are very significant when a client asks you to help them make a decision. Let's say I need a new roof. Let's say it's $10,000. If I'm right on the edge of a tax bracket, say 28%, if I do it this year, I have to pay an extra $2,800 in taxes. Sure, that only increases my average tax rate to say something like 16%, but if you only waited until after the first of the year, you'd have saved $2,800. I bet when you shopped for the roof, all other things being equal, you'd jump at the opportunity to have it done for $2,800 less.

I think your example proves my point.

When you advise your clients, you point out the $2,800 savings as the reason to change their decision, not the 28% marginal rate. And it's the existence or non-existence of an edge case that may or may not make it significant.

"Wait until after the first of the year because you will save $2,800" makes sense. "Wait until after the first of the year because otherwise you'll be in the 28% marginal tax bracket" makes less sense. The latter without the former has no value.

Marginal tax rates, humps, etc - all are interesting and fun to chart. But at least for me, these decisions come down to how much I'll spend, how much I'll save, and what are the alternatives.
 
Last edited:
^ Yes but 28% of $10k is $2.8k so that totally demolishes your argument.
 
This subject matter interests me and perhaps my question should be a new thread.

For those of you in ER (under 65) generating higher incomes from your investments (say $300K+, no earned income), what tools/spreadsheets do you use to ideally plan to minimize your taxes? I’m 2 yrs from launch so have plugged in a nominal 25%, but clearly being strategic with how you draw from your taxable and tax differed accounts can equate to some real $. Obviously your individual state income taxes will affect your final effective tax rate, but I would love to hear how some of you higher ER earners have gotten your effective tax antes down.
 
For those of you in ER (under 65) generating higher incomes from your investments (say $300K+, no earned income), what tools/spreadsheets do you use to ideally plan to minimize your taxes?

Assuming 300k taxable earnings from dividends from something like an S&P 500 fund (approx 2% divy) would be what, maybe $15MM. Out of my league.
 
....For those of you in ER (under 65) generating higher incomes from your investments (say $300K+, no earned income), what tools/spreadsheets do you use to ideally plan to minimize your taxes?....

I'm not in that league but it is same principal except smaller numbers.

My Excel based retirement planning spreadsheet is a 40+ year deterministic projection of the progression of our taxable, tax-deferred and tax-free assets considering our spending, my pension, SS, mortgage payments, etc.

Embedded within that projection is a simplified tax calculation that projects taxable income, ordinary and qualified income and federal and state income taxes.

The taxable income includes taxable account dividends, capital gains from sales of assets to support spending, pension, 85% of SS, Roth conversions, IRA withdrawals, RMDs, less the higher of the standard deduction or the sum of property taxes, state income taxes, mortgage interest, and contributions... less 2 exemptions.

Since going forward under the new law we'll likely be using the standard deduction, it will be much simpler. In 2018 I'll probably reconstruct it from scratch since our financial life is more simple now than it was when I first put it together.
 
As one data point, you might try i-orp. You need to click the extended orp link. It will take a while to get all the inputs understood and populated. It very often suggests more Roth conversions than people are comfortable with, but it offers a limit of Roth conversions, so if going unlimited doesn't provide a big improvement, the bird in the hand principle can win out. I also recommend a 'middle of the bell curve' plan duration, rather than the optimistic long tail duration when doing this kind of exercise.
 
PB4uski, if you do build one from scratch, could you be persuaded to make it kind of generic so it could be shared?
 
PB4uski, if you do build one from scratch, could you be persuaded to make it kind of generic so it could be shared?

Ooh, ooh!! And maybe include comments/notes in the cells to explain what is going on? Again, only if it is convenient for you.
 
^ Yes but 28% of $10k is $2.8k so that totally demolishes your argument.

If your advisor told you to wait to fix your leaky roof for one year, because it would make your marginal tax rate 52.7% would you agree to do it?

What if your advisor told you to wait to fix your leaky roof for one year, because it would cost you an addition $5.27 in taxes?

It's the amount that matters, not the rate.
 
^ One pays to fix the leaky roof from emergency fund cash reserves that are sitting in a bank account. One prudently includes this in their long term plan, having analyzed the implications of all kind of financial actions, which includes knowing all kinds of rates (or simply take the advice of those who have done such analysis).

Also you are trying to contradict the basic math that for three non-zero numbers A, B, C, if
AB=C,
then any two of the numbers determine the third. That's just fact.

That is indeed how math works.

Even though I will probably be in the 22% tax bracket next year, the price of my favorite donut just went up by 25%. But I plan to buy one anyway, because I can afford the additional $0.25 - rate be damned! :)
 
^ Consider tax software. It is full of all kinds of stuff, including many rates. Those rates are already there, before you or anyone else puts in their numbers. They're part of financial reality, whether you like it or not.

For long term planning, it is prudent to try to understand the applicable rates and other features. There's major money to be gained or lost due to good or bad/no planning. Take it or leave it.
 
Tax software is useful, but the packages that I am aware of only tell you what your current federal tax bracket is. They usually do not tell you your “marginal” tax bracket, how much additional tax will you pay for an additional dollar of income. Your tax bracket is only one of the three channels of IRS taxation that make up your marginal bracket. You can also be in a situation where the previously deferred taxation of Social Security benefits and previously deferred taxation of dividend income all happen at the same time.
NewHumps.jpg

How much gross income you get before paying taxes, at what income level does your Tax Hump start, and how wide that Tax Hump is totally depends on your personal Social Security benefit level.


Having a picture of your personal marginal tax brackets and knowing where your planned retirement income / standard of living will place you in relationship to your personal brackets can be a very valuable piece of information.

If you are going to minimize your SS benefits by starting them at age 62, the impact of your Hump will be minimal so no need to plan around it. If you are going to maximize your benefits by waiting until you are 70, this picture indicates that your personal hump might not start until about a gross income of $69,120 and will continue for the next $13,440. Paying an extra 18.7% in federal taxes can give the IRS more than $2,500 extra each year, a nice thing to avoid if you can!

The old cliché says that a picture is worth a thousand words, in this case it might be worth thousands of dollars!
 
Last edited:
Tax software is useful, but the packages that I am aware of only tell you what your current federal tax bracket is. They usually do not tell you your “marginal” tax bracket, how much additional tax will you pay for an additional dollar of income.
True, but the overall marginal tax rate and the effective marginal rate for interest, cap gains, what-ifs regarding various tax credits, etc can all be found by poking numbers into the tax software. If you raise your earned income by $100 and your taxes increase by $15, you have a pretty good idea what your marginal rate is. This can require some iterative steps and it isn't fast or elegant, but it does have the advantage of being free and very comprehensive (e.g. it will likely include the impact of obscure credits or phase-outs that might not be covered by a program that doesn't actually do all the work of computing the "real" tax liability.

This What-if analysis is, IMO, a tremendous advantage of doing my taxes myself. I could have an accountant or tax service do the computations, but I'd lose a lot of insight into how the law works on practice, and how I can reduce the taxes I pay on the future.


Having a picture of your personal marginal tax brackets and knowing where your planned retirement income / standard of living will place you in relationship to your personal brackets can be a very valuable piece of information.
Agreed. This would be great for planning.
 
Last edited:
When you combine the new 22% bracket with the 85% taxability of your Social Security benefits you end up in a 40.7% marginal tax bracket until 85% of your benefits have been taxed. If some of your income is from Dividends or Long Term Gains, pushing those into the 22% bracket can result in a marginal tax bracket of 49.95%.
If LTCG and Dividends count as income for SS tax-ability, then I stand with my earlier quote about having to have a planned budget in the program. For me half of my normal income of dividends comes in the last month of the year. If you are going to generate an alarm, you need to account for future income before it happens. The only way to do this just for real time acknowledgement of income would be if you could stop all income for the rest of the year. Without the ability to stop all income, you would be warned with no way to stop climbing the cliff.

Tax software is useful, but the packages that I am aware of only tell you what your current federal tax bracket is. They usually do not tell you your “marginal” tax bracket, how much additional tax will you pay for an additional dollar of income. Your tax bracket is only one of the three channels of IRS taxation that make up your marginal bracket. You can also be in a situation where the previously deferred taxation of Social Security benefits and previously deferred taxation of dividend income all happen at the same time.
NewHumps.jpg

How much gross income you get before paying taxes, at what income level does your Tax Hump start, and how wide that Tax Hump is totally depends on your personal Social Security benefit level.


Having a picture of your personal marginal tax brackets and knowing where your planned retirement income / standard of living will place you in relationship to your personal brackets can be a very valuable piece of information.

If you are going to minimize your SS benefits by starting them at age 62, the impact of your Hump will be minimal so no need to plan around it. If you are going to maximize your benefits by waiting until you are 70, this picture indicates that your personal hump might not start until about a gross income of $69,120 and will continue for the next $13,440. Paying an extra 18.7% in federal taxes can give the IRS more than $2,500 extra each year, a nice thing to avoid if you can!

The old cliché says that a picture is worth a thousand words, in this case it might be worth thousands of dollars!
I'm aware of the taxation of SS. I expect I will end up having to pay it in the end. I'm looking at things I think I can affect.
 
I'm aware of the taxation of SS. I expect I will end up having to pay it in the end. I'm looking at things I think I can affect.
Not sure of your age and time before retirement, but one of the things we did, prior to retirement, was Roth Conversions. We did some major ones in 2016 when BRexit crashed the market. We also over did the conversions and used recharacterization to “keep the best and undo the rest”, but the new tax law no longer allows recharacterizations, so you would have to be more selective.
 
I just used my spreadsheet to put together this chart showing the cost of the Hump taxes when you are receiving larger Social Security benefits.
HumpCost.jpg

The data lines that create the graph are in $160 increments. The only “input” difference is in the ordinary income column, withdraws from IRA etc. $29,960 is the last line at the 22.2% bracket before it jumps to 49.95% and $43,720 is the first line after it bracket drops back to 22%.

The additional $13,760 of income increases your federal taxes by $5,710. The standard 22% rate would have cost only $3,027. The extra Hump taxes were $2,683.

If you could have done Roth Conversions at 22% prior to starting your Social Security instead of taking the money out of your IRA after starting Social Security you would save up to $2,683 a year.
 
In Canada you reach the max marg tax rate at fairly low incomes, ie $200,000-300,000. For high earners this makes it pretty simple since they will always be paying the max at the margin. The tax rates are different for the 3 main types of income(regular, cap gains, divs). If you know what these marg rates are, planning is easy.
 
The problem in the US is what I like to call parallel taxation. The 49.95% marginal rate happens when, for example, you get $100 from a taxable source. That is the only extra money that you get, but that extra $100 makes $85 of your Social Security taxable, at the same time, in parallel. That combined $185 also makes $185 of your dividend income taxable, again at the same time, what I call the parallel taxation of your parallel taxation.

You only got $100 from a single source, but that causes the IRS to tax you on 3 separate sources of income.
 
The good news is they fixed all this in the tax reform bill and simplified filing! Not! Sorry I would not resist :)
 
The problem in the US is what I like to call parallel taxation. The 49.95% marginal rate happens when, for example, you get $100 from a taxable source. That is the only extra money that you get, but that extra $100 makes $85 of your Social Security taxable, at the same time, in parallel. That combined $185 also makes $185 of your dividend income taxable, again at the same time, what I call the parallel taxation of your parallel taxation.

You only got $100 from a single source, but that causes the IRS to tax you on 3 separate sources of income.
This would be productive topic for some type of overarching/"metalegislation" covering the maximum "slope" of taxation cliffs, maximum effective marginal tax rates (including losses of tax credits?), etc. Unfortunately, the only tool we have for that is a constitutional amendment, which hardly seems appropriate for a relatively narrow problem like this.
 
I just used my spreadsheet to put together this chart showing the cost of the Hump taxes when you are receiving larger Social Security benefits.
HumpCost.jpg

The data lines that create the graph are in $160 increments. The only “input” difference is in the ordinary income column, withdraws from IRA etc. $29,960 is the last line at the 22.2% bracket before it jumps to 49.95% and $43,720 is the first line after it bracket drops back to 22%.

The additional $13,760 of income increases your federal taxes by $5,710. The standard 22% rate would have cost only $3,027. The extra Hump taxes were $2,683.

If you could have done Roth Conversions at 22% prior to starting your Social Security instead of taking the money out of your IRA after starting Social Security you would save up to $2,683 a year.

I'm sorry, given the holidays and all, I may have missed a response regarding my question. Is there a software or link to a spreadsheet that one can use to model this "hump" type of impact? I did read that some just use a tax software and tweak the numbers to see the impact, but the simplicity of the graph above and inputting gross numbers for LTCG, Ordinary income, etc is nice. At least something I can start to understand.

Bob
 
Back
Top Bottom