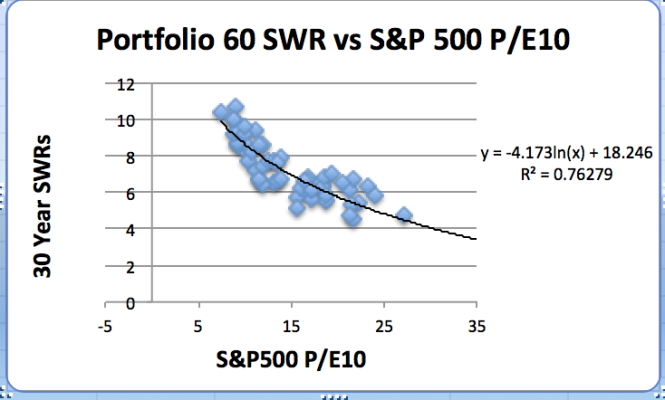
I was playing around with SWRs when the market is priced high and came across an interesting result. Attached is a graph of 30 year SWRs versus Schiller’s PACE (P/E10 – an indicator of how costly stock market prices are) for the S&P 500. The P/E10 and SWR are both calculated at the beginning of retirement for retirement years since 1928. The data is for a diversified portfolio of 60% equities and 40% short term treasuries. A few days ago the the P/E10 was 28.85, giving a SWR of 4.2% with a 50% chance of survival, or a SWR of 3.45% for an 85% chance of survival. Curiously, a more conservative portfolio of 40% equities and 60% treasuries gives SWRs of 4.05%(50% survival) and 3.25% (85% survival), so it is not safer.
You are using an out of date browser. It may not display this or other websites correctly.
You should upgrade or use an alternative browser.
You should upgrade or use an alternative browser.
Retiring When Market is High
- Thread starter Navigator
- Start date
Continued
Here’s where it gets interesting. Say I retire to day with a 1 million dollar portfolio, expecting to withdraw $34,500 per year (3.45%). However, tomorrow the stock market tanks, falling 30%. My portfolio would be worth $820,000 (70% of $600,000 + $400,000), but my new SWR would be 4.99%, allowing me to withdraw about $40,900 per year. In other words, a falling market gives me the strange result of having more money per year! This happens because my portfolio of 60% stocks falls by only 18%, but the SWR rises by 45%.
Here’s where it gets interesting. Say I retire to day with a 1 million dollar portfolio, expecting to withdraw $34,500 per year (3.45%). However, tomorrow the stock market tanks, falling 30%. My portfolio would be worth $820,000 (70% of $600,000 + $400,000), but my new SWR would be 4.99%, allowing me to withdraw about $40,900 per year. In other words, a falling market gives me the strange result of having more money per year! This happens because my portfolio of 60% stocks falls by only 18%, but the SWR rises by 45%.
street
Give me a museum and I'll fill it. (Picasso) Give me a forum ...
- Joined
- Nov 30, 2016
- Messages
- 9,585
Interesting. I don't go by a WR I use what we need but my WR is very low so I don't take a 3.5% per se each year or each month from my portfolio.
My question is why don't you adjust WR as your portfolio adjusts to the markets. Your WR would be different from 800K verses 900K if you want a 3.5% WR.
My question is why don't you adjust WR as your portfolio adjusts to the markets. Your WR would be different from 800K verses 900K if you want a 3.5% WR.
brett
Give me a museum and I'll fill it. (Picasso) Give me a forum ...
- Joined
- Apr 24, 2010
- Messages
- 5,926
It is a definite issue. I would be concerned with sequence of returns. I say this because I did not think about it.
We must have had horseshoes because sequence of returns were excellent during our first five years of retirement. It would not have been pleasant had they been the opposite.
I would consider this in your investment allocations. Sequence of returns can have a huge impact on your long term resources.
We must have had horseshoes because sequence of returns were excellent during our first five years of retirement. It would not have been pleasant had they been the opposite.
I would consider this in your investment allocations. Sequence of returns can have a huge impact on your long term resources.
Cut-Throat
Thinks s/he gets paid by the post
Here’s where it gets interesting. Say I retire to day with a 1 million dollar portfolio, expecting to withdraw $34,500 per year (3.45%). However, tomorrow the stock market tanks, falling 30%. My portfolio would be worth $820,000 (70% of $600,000 + $400,000), but my new SWR would be 4.99%, allowing me to withdraw about $40,900 per year. In other words, a falling market gives me the strange result of having more money per year! This happens because my portfolio of 60% stocks falls by only 18%, but the SWR rises by 45%.
See VPW.
audreyh1
Give me a museum and I'll fill it. (Picasso) Give me a forum ...
Not that surprising. Since the supposedly the CAPE10 dropped dramatically after a 30% equity drop, it's now safe to use a higher withdrawal rate.
I guess it's interesting that it gives you a higher actual number.
Some folks here do vary their withdrawal rate such that they are drawing less in what they perceive is a higher valuation market, and draw %-wise more in a lower valuation market.
I guess it's interesting that it gives you a higher actual number.
Some folks here do vary their withdrawal rate such that they are drawing less in what they perceive is a higher valuation market, and draw %-wise more in a lower valuation market.
Last edited:
NW-Bound
Give me a museum and I'll fill it. (Picasso) Give me a forum ...
- Joined
- Jul 3, 2008
- Messages
- 35,712
Of course a lower CAPE10 would give a higher WR in percentage. That's not surprising.
But I agree with the OP that when it gives a higher dollar amount, that's interesting.
If one maintains the WR of $34.5K, the WR percentage will change from 3.45% to 4.2% on the new portfolio balance of $820K, albeit with a lower and safer CAPE10. However, his curvefit says he can go to 4.99%, and withdraws more!
The more the market drops, the more dollar amount one can get.") That's nice!
That's nice!
Perhaps this is an artifact of curve-fitting to "noisy" data.
But I agree with the OP that when it gives a higher dollar amount, that's interesting.
If one maintains the WR of $34.5K, the WR percentage will change from 3.45% to 4.2% on the new portfolio balance of $820K, albeit with a lower and safer CAPE10. However, his curvefit says he can go to 4.99%, and withdraws more!
The more the market drops, the more dollar amount one can get.
That's nice!Perhaps this is an artifact of curve-fitting to "noisy" data.
Last edited:
walkinwood
Thinks s/he gets paid by the post
I was playing around with SWRs when the market is priced high and came across an interesting result. Attached is a graph of 30 year SWRs versus Schiller’s PACE (P/E10 – an indicator of how costly stock market prices are) for the S&P 500. The P/E10 and SWR are both calculated at the beginning of retirement for retirement years since 1928. The data is for a diversified portfolio of 60% equities and 40% short term treasuries. A few days ago the the P/E10 was 28.85, giving a SWR of 4.2% with a 50% chance of survival, or a SWR of 3.45% for an 85% chance of survival. Curiously, a more conservative portfolio of 40% equities and 60% treasuries gives SWRs of 4.05%(50% survival) and 3.25% (85% survival), so it is not safer.
Didn't Bengen and others show that a ~4% SWR had a >90% chance of survival based on historical data going back to 1928?
How do you explain that with your data?
It is tempting to use one metric to explain a very complex set of interactions between equity returns, bond returns and inflation - but how accurate can it be? Schiller's PACE takes no account of inflation or bond returns.
ncbill
Thinks s/he gets paid by the post
You'll be OK even if you buy equities at market highs:
https://awealthofcommonsense.com/2014/02/worlds-worst-market-timer/
https://awealthofcommonsense.com/2014/02/worlds-worst-market-timer/
NW-Bound
Give me a museum and I'll fill it. (Picasso) Give me a forum ...
- Joined
- Jul 3, 2008
- Messages
- 35,712
You'll be OK even if you buy equities at market highs:
https://awealthofcommonsense.com/2014/02/worlds-worst-market-timer/
Buying high is OK while you are saving for retirement.
What the OP talks about is for a retiree in the spend-down mode. He is looking at quantifying how one should reduce the WR during frothy market conditions.
I do not see anything wrong with the methodology, but the result causes some head scratching.
PS. I am doing WR lower than 3%, and that's even with SS being delayed. Perhaps I will die rich, but it's OK. I do not feel like blowing dough on anything.
Last edited:
Didn't Bengen and others show that a ~4% SWR had a >90% chance of survival based on historical data going back to 1928?
How do you explain that with your data?
It is tempting to use one metric to explain a very complex set of interactions between equity returns, bond returns and inflation - but how accurate can it be? Schiller's PACE takes no account of inflation or bond returns.
Begen used large cap stock returns to come up with his 4% rule, but later revised that to 4.5% if small cap stocks are also used. The data I used includes small cap and some foreign stocks, but also shows that historically, a 4.5% withdrawal rate has been safe. The graph uses a best fit of the data and shows its spread. The graph curve interpolates between historical data points and extends beyond the historical data.
Your Point about Schiller’s PACE not including bond returns (or small cap stocks) is well taken. However, it is the best measure of stock market pricing I could find, and it does account for over 75% of variation in historical SWRs for the portfolio shown.
GravitySucks
Thinks s/he gets paid by the post
Begen used large cap stock returns to come up with his 4% rule, but later revised that to 4.5% if small cap stocks are also used. The data I used includes small cap and some foreign stocks, but also shows that historically, a 4.5% withdrawal rate has been safe. The graph uses a best fit of the data and shows its spread. The graph curve interpolates between historical data points and extends beyond the historical data.
Your Point about Schiller’s PACE not including bond returns (or small cap stocks) is well taken. However, it is the best measure of stock market pricing I could find, and it does account for over 75% of variation in historical SWRs for the portfolio shown.
Bengen also used intermediate term treasuries where you are using short term treasuries. I think that contributes greater to the differences.
I was playing around with SWRs when the market is priced high and came across an interesting result. Attached is a graph of 30 year SWRs versus Schiller’s PACE (P/E10 – an indicator of how costly stock market prices are) for the S&P 500. The P/E10 and SWR are both calculated at the beginning of retirement for retirement years since 1928. The data is for a diversified portfolio of 60% equities and 40% short term treasuries. A few days ago the the P/E10 was 28.85, giving a SWR of 4.2% with a 50% chance of survival, or a SWR of 3.45% for an 85% chance of survival. Curiously, a more conservative portfolio of 40% equities and 60% treasuries gives SWRs of 4.05%(50% survival) and 3.25% (85% survival), so it is not safer.
IMO, many people don't choose conservative allocations (e.g. 40/60) because they think they are safer but rather to mitigate behavioral issues.
Cut-Throat
Thinks s/he gets paid by the post
I was playing around with SWRs when the market is priced high and came across an interesting result. Attached is a graph of 30 year SWRs versus Schiller’s PACE (P/E10 – an indicator of how costly stock market prices are) for the S&P 500. The P/E10 and SWR are both calculated at the beginning of retirement for retirement years since 1928. The data is for a diversified portfolio of 60% equities and 40% short term treasuries. A few days ago the the P/E10 was 28.85, giving a SWR of 4.2% with a 50% chance of survival, or a SWR of 3.45% for an 85% chance of survival. Curiously, a more conservative portfolio of 40% equities and 60% treasuries gives SWRs of 4.05%(50% survival) and 3.25% (85% survival), so it is not safer.
Valuations do not predict the 'Sequence of Returns' Problem. --- So, this is hardly surprising.
And a fixed SWR (with inflation adjustment) is NEVER 'Safer' than a variable method, and a very poor withdrawal tool, which I'm pretty sure no one has ever used, other than a planning tool..... If you use VPW, you can mitigate this situation.... And there you employ lower stock allocations for less volatility of withdrawals.
And VPW will let you spend more than an SWR well over 90% of the time.
Last edited:
Ed_The_Gypsy
Give me a museum and I'll fill it. (Picasso) Give me a forum ...
At the moment, we are using 3% of current account not adjusted for inflation.
Valuations do not predict the 'Sequence of Returns' Problem. --- So, this is hardly surprising.
And a fixed SWR (with inflation adjustment) is NEVER 'Safer' than a variable method, and a very poor withdrawal tool, which I'm pretty sure no one has ever used, other than a planning tool..... If you use VPW, you can mitigate this situation.... And there you employ lower stock allocations for less volatility of withdrawals.
And VPW will let you spend more than an SWR well over 90% of the time.
I would certainly agree that variable withdrawal rates make better sense than fixed withdrawal rates. I do think, though, that looking at fixed withdrawal rates gives a good basis for choosing an initial portfolio allocation and withdrawal rate, which can be adjusted as circumstances dictate.
I think that is right. It gives you a calibration tool. I know a lot of retirees - I don't know anyone who uses a fixed withdrawal rate (other than ones who have only pension + SS). In fact, I don't know anyone who uses any kind of mathematical system, period.I would certainly agree that variable withdrawal rates make better sense than fixed withdrawal rates. I do think, though, that looking at fixed withdrawal rates gives a good basis for choosing an initial portfolio allocation and withdrawal rate, which can be adjusted as circumstances dictate.
IMO, many people don't choose conservative allocations (e.g. 40/60) because they think they are safer but rather to mitigate behavioral issues.
I suppose that’s why financial planners give clients a risk tolerance questionnaire. Fear can be a powerful motivator, but I like to think that the more people know about money the better their financial decisions in retirement will be. I certainly hope that is true for me.
I think it would be only natural to cut back on a WR after a major drop in stock prices especially if that happened early after retirement. I would target discretionary and entertainment spending first.
This is also why that bucket system would be important. You could use the cash account and hopefully wait for stocks to recover before needing to sell any equities.
I think proper retirement planning would mean you’d be prepared for these worst case scenarios. Of course, that doesn’t mean I wouldn’t be concerned.
I don’t see anyone mention having 10% in cash always in a disciplined way. IOW, behave as if you only have the 90% to invest.
I’m not retired yet but would like to do this. Anyone doing this? Any tips on the cash generation?
I’m not retired yet but would like to do this. Anyone doing this? Any tips on the cash generation?
Dtail
Give me a museum and I'll fill it. (Picasso) Give me a forum ...
I don’t see anyone mention having 10% in cash always in a disciplined way. IOW, behave as if you only have the 90% to invest.
I’m not retired yet but would like to do this. Anyone doing this? Any tips on the cash generation?
We have ~9% cash/short term CD's in our "taxable" account to use for management of MAGI for ACA subsidies. The % will drop each year all things being equal in the market.
A bunch of coincidences as to how it was built up.
Cut-Throat
Thinks s/he gets paid by the post
I don't know anyone who uses a fixed withdrawal rate (other than ones who have only pension + SS). In fact, I don't know anyone who uses any kind of mathematical system, period.
Glad to meet you jebmke !
COcheesehead
Give me a museum and I'll fill it. (Picasso) Give me a forum ...
I don’t see anyone mention having 10% in cash always in a disciplined way. IOW, behave as if you only have the 90% to invest.
I’m not retired yet but would like to do this. Anyone doing this? Any tips on the cash generation?
10% cash for me would equal almost 6 years of income. To me that is overkill. Would rather have cash flow from a variety of resources that do not require equity sales, unless I want to tax loss harvest.
Similar threads
- Replies
- 144
- Views
- 9K
- Replies
- 20
- Views
- 2K
- Replies
- 26
- Views
- 1K