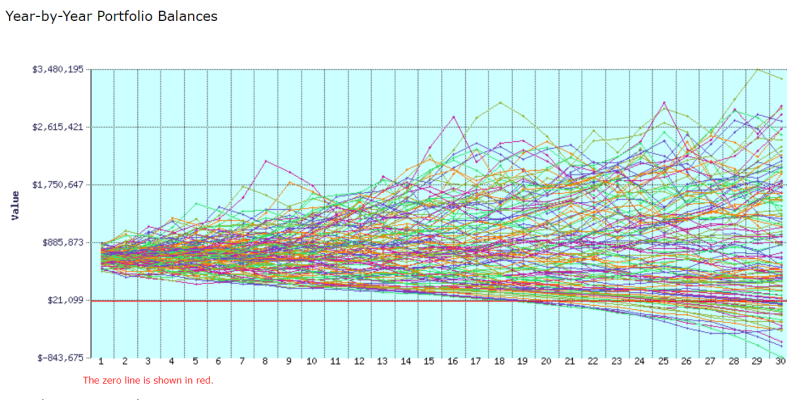
start value 650,000, results graph says 583,951
what's with that? Doesn't even match if year 1 has subtracted year zero spending.
Spending 65k year.
AFAIK I have zeroed every other input page.
A portfolio with consistent growth of 0%, and an inflation rate of 0%
So should reach zero in ten years; that works.
what's with that? Doesn't even match if year 1 has subtracted year zero spending.
Spending 65k year.
AFAIK I have zeroed every other input page.
A portfolio with consistent growth of 0%, and an inflation rate of 0%
So should reach zero in ten years; that works.