I didn’t find it all that difficult to understand. Maybe it’s easier to grasp if I said when the market declines, 64% of the time its 5%.
Don't know. Don't know what it's supposed to represent, what it's measuring, or what it means. I do like the colors.And the point of this is ....
The point is that 5% drops are common.
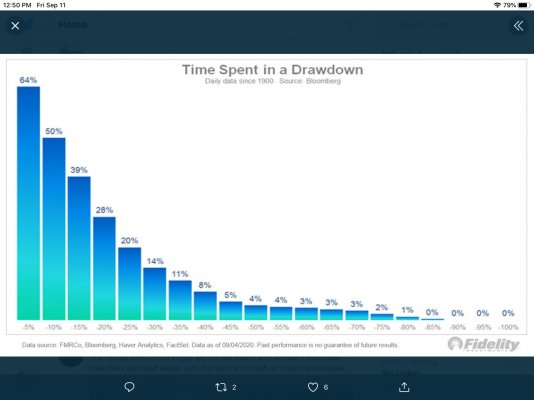
Fidelity presented that chart today showing that where we are at in the market right now is the most common place since 1900...if we rebound from here.
A drawdown is a unique event, not a fluid process. So a 5% drawdown followed by a rebound happens 64% of the time.
If we continue to drop, then the drawdown percentage is a TBD and we end up somewhere down the right side of the chart.
I still am confused. Why do the percentages not add up to 100?
OK. It usually goes up after dropping a little. No kidding.
This chart shows the the percentage of the total number of days between 1900 and 2020 (regardless of the sign of the daily return) that in retrospect were part of a drawdown of less than X% with with X ranging from −5% to −100%. Daily data from 1900 through 09/04/2020. Source: Bloomberg.
I think one of their interns was left unsupervised for too long.This chart shows the the percentage of the total number of days between 1900 and 2020 (regardless of the sign of the daily return) that in retrospect were part of a drawdown of less than X% with with X ranging from −5% to −100%. Daily data from 1900 through 09/04/2020.
See post #5. Put differently, if the market is 20% down, it counts in the 5%, 10%, 15%, and 20% columns. That's why it adds up to more than 100.I still am confused. Why do the percentages not add up to 100?