Which bonds did best in the last 2 rate ramps?

Which bond funds did best in the last two rate ramps?

  • 3 month Tbills rolled over every 3 months (not a fund, but cash like)

    Votes: 0 0.0%
  • VFIRX, Vanguard short term Treasury

    Votes: 0 0.0%
  • VFSUX, Vanguard short term Investment Grade

    Votes: 2 33.3%
  • VBTLX, Vanguard total bond market

    Votes: 1 16.7%
  • VFIDX, Vanguard intermediate term Invesment Grade

    Votes: 2 33.3%
  • Other bond fund (tell us below)

    Votes: 1 16.7%

  • Total voters
    6

Lsbcal

Give me a museum and I'll fill it. (Picasso) Give me a forum ...
Joined
May 28, 2006
Messages
8,811
Location
west coast, hi there!
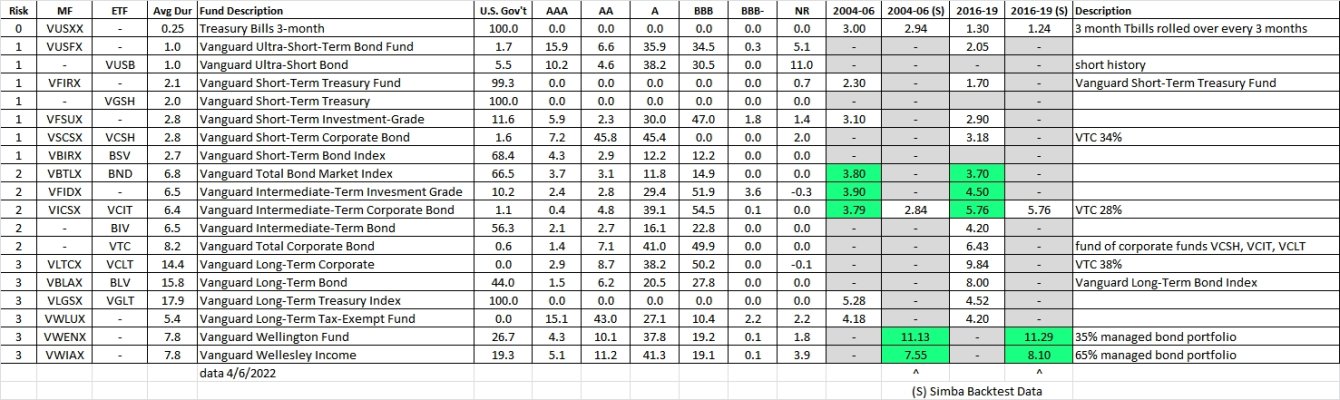
We have had two periods of Fed Funds rate being ramped up by the Federal Reserve. The 3 month Treasury bills closely follow these ramp ups. These periods were roughly the 2004-2006 period and the 2016-2019 period. Here is a chart of the Fed Funds rate showing the two periods (yellow highlighted):

image2.jpg


The Fed has just last week embarked on another planned ramp up. The Fed meets 8 times per year and they have announced their intention of bumping up the rates, probably at each meeting going forward.

Which bonds out of the choices presented did the best in those two past interest rate ramp ups? I will show the past results in a few days to give time for your guesses.

Caveat: I am not suggesting history will exactly repeat going forward but it is interesting to know what worked in the recent past.
 
Last edited:
Here are the results of my comparisons. All numbers are percent. The 2016 ramp resulted in pretty good CAGR's (compound annual growth rates) with quite a bit of variations year to year. In that period Fed Funds rates started from the same very low level as now. VFIDX (intermediate term investment grade) was the best followed closely by VBTLX (total bond market). VFIDX was the winner (light green) in 4 of the 7 years shown.

I think it is interesting that the longest duration funds (VFIDX and VBTLX) did the best if you were patient. The results might well have been different if the ramps were interrupted by a recession but that did not happen.

image3.jpg


In 2004-2006 the ramp rate was 17 basis points per month.
In 2016-2019 the ramp rate was 6 basis points per month.

There could be some fireworks along the way. Just today Fed chairman Powell said that a 50 bp rate hike could happen and the bond markets took a dive.
 
Thanks. I'm wondering if I should move some of my VBTLX holdings to VFSUX. Would like to stick with Vanguard.
 
Thanks. I'm wondering if I should move some of my VBTLX holdings to VFSUX. Would like to stick with Vanguard.

FWIW, right now I will be rolling over 3 month Tbills. Next decision date is April 21st.

When I feel the situation is stabilizing VFSUX or VFIDX would be my choices. To be honest this is not based on any great past history examples. How often do we have such inflation surges? About as often as pandemics and Russian invasions.

Should I move to bond funds if the stock market started rolling over with unemployment ticking up, I would then move to 5 year Treasuries (VFIUX). This is based on some past good results.
 
How often do we have such inflation surges? About as often as pandemics and Russian invasions.

True, but are you citing the inflation surge as the cause of the bond mutual fund downturn? Or is it that inflation is driving interest rate rise, thus causing the bond mutual fund market downturn? Not challenging, just trying to understand.

What I've realized is that I am disproportionately heavy in VBTLX compared to shorter duration bond funds. I may reallocate.
 
Last edited by a moderator:
Firstly, I am no expert in these subtle cause/effect economics. As a bond investor I would like a real (not just nominal) return and historically this has been the case. But of course one does not get that return consistently over time.

I think that the high inflation is due to the pandemic (supply/demand disruptions, government spending, wage inflation). Now we add in the Russia/Ukraine war with the driving up of energy prices. So inflation is the first outcome and then comes interest rate rises as investors require more return and anticipate increases in the Federal Funds (short term) rate.
 
Here are the results of my comparisons. All numbers are percent. The 2016 ramp resulted in pretty good CAGR's (compound annual growth rates) with quite a bit of variations year to year. In that period Fed Funds rates started from the same very low level as now. VFIDX (intermediate term investment grade) was the best followed closely by VBTLX (total bond market). VFIDX was the winner (light green) in 4 of the 7 years shown.

I think it is interesting that the longest duration funds (VFIDX and VBTLX) did the best if you were patient. The results might well have been different if the ramps were interrupted by a recession but that did not happen.

image3.jpg


In 2004-2006 the ramp rate was 17 basis points per month.
In 2016-2019 the ramp rate was 6 basis points per month.

There could be some fireworks along the way. Just today Fed chairman Powell said that a 50 bp rate hike could happen and the bond markets took a dive.
I hope these questions are acceptable.

For the performance numbers did those all come from one source? Was it an entire year's performance?

I'm asking because I'd like to also look at long term VBLAX performance.

I looked up ETF equivalents (in parens), but haven't double-checked.
3 month Tbills rolled over every 3 months (not a fund, but cash like)
VFIRX, Vanguard short term Treasury (VGSH)
VFSUX, Vanguard short term Investment Grade (BSV)
VBTLX, Vanguard total bond market (BND)
VFIDX, Vanguard intermediate term Invesment Grade (BIV)
Other bond fund (tell us below)

VBLAX, Vanguard Long-Term Bond BLV
 
Interesting facts, but which one would protect the best as ballast in a stock downturn? That would be more interesting considered the current environment.
 
I hope these questions are acceptable.

For the performance numbers did those all come from one source? Was it an entire year's performance?

I'm asking because I'd like to also look at long term VBLAX performance.

I looked up ETF equivalents (in parens), but haven't double-checked.
3 month Tbills rolled over every 3 months (not a fund, but cash like)
VFIRX, Vanguard short term Treasury (VGSH)
VFSUX, Vanguard short term Investment Grade (BSV)
VBTLX, Vanguard total bond market (BND)
VFIDX, Vanguard intermediate term Invesment Grade (BIV)
Other bond fund (tell us below)

VBLAX, Vanguard Long-Term Bond BLV

I have monthly data for the funds but this annual data came from Morningstar. They probably have similar annual data for ETF equivalents. For the Tbills I took the yields off of the Fed site for 3 month Treasuries in the secondary market and assumed buying one month and holding for another two months.

Since I've used VFSUX a lot I compared the charts of VFSUX and BSV in M*. They are not at all similar. If there is an ETF equivalent Vanguard will show it at the top of their bond fund data sheet pages and they do not show it for VFSUX. However, VCSH is a similar bond fund with similar long term results (actually a little better performance). You can see this by comparing their charts on M*.

I never considered VBLAX. As you probably know it has a duration of 15.8 years.
 
Interesting facts, but which one would protect the best as ballast in a stock downturn? That would be more interesting considered the current environment.

If you were going to buy/hold the bond fund and expected a bad stock market (not just a sideways one) then you'd probably go with Treasuries.
 
The next Fed Reserve meeting announcement is May 4. This site gives the market probabilities of rate hikes: https://www.cmegroup.com/trading/interest-rates/countdown-to-fomc.html This is based on Fed Funds future contracts which you can read about on that site.

Here is the current probabilities:


image4.jpg


I don't know how seriously to take this but it is a better guess then my finger in the wind. The current 3 month Tbills are at 0.53% so this implies they may be as high as 1.0% by May. You can also see the current Fed "dot plot" on the CME site.

I don't know how much of this is built into the current yield curve. Probably all of it.
 
This time could be different, yes these are dangerous words. The 5 year Treasury has moved up well ahead of the likely Fed Funds rate ramp.

Could it be that much of the intermediate bond fund losses are behind us?


image4.jpg
 
Unlike prior rate rise cycles we begin from a historic low level and the rise figures to be rapid, if you believe the dots.

Long duration funds "work" when rates decline sharply after a rate hike. That could be the scenario here but impossible to know. Betting on that is a large risk that I find inappropriate for my fixed income portfolio.

I think individual tbills/tnotes or floating rate debt funds are the most logical choice here.
 
I have monthly data for the funds but this annual data came from Morningstar. They probably have similar annual data for ETF equivalents. For the Tbills I took the yields off of the Fed site for 3 month Treasuries in the secondary market and assumed buying one month and holding for another two months.

Since I've used VFSUX a lot I compared the charts of VFSUX and BSV in M*. They are not at all similar. If there is an ETF equivalent Vanguard will show it at the top of their bond fund data sheet pages and they do not show it for VFSUX. However, VCSH is a similar bond fund with similar long term results (actually a little better performance). You can see this by comparing their charts on M*.

I never considered VBLAX. As you probably know it has a duration of 15.8 years.
I had noticed that VFSUX didn't have an ETF equivalent, but somehow I came up with the wrong equivalent.

VBLAX also has a purchase fee of 0.50%, making it even less attractive. The ETF equivalent BLV does not have that fee. Something I just noticed.
 
I was mostly VBTLX with a little VFSUX, but I did some exchanges to make them 50:50 for the foreseeable future. I am thinking about moving my AA from 50:50 to 60:40 as well, putting some bond fund allocation into the REIT I hold. Not a great outlook for bond funds but I’ll ride it out for the most part…sigh.
 
In the original charts I should have added inflation which is, of course, dramatically accelerating at present:


image4.jpg


And here is the earlier period at a difference scale to account for the 1970's:


image3.jpg
 
I went further with the OP's table. Searched on M* and Vanguard sites and collected more data. I also used the Simba backtest sheet for average return during inflation period mentioned.

It is interesting how much can be collected. This helped me understand what is in the funds.

Results shaded in green seem to me to be reasonable picks. I'll have to take a closer look at the allocation we have now.

Quite a ways back I decided to use VWIAX in an IRA, in lieu of VBTLX. Apples and oranges for sure.
 

Attachments

  • Bonds Inflation Periods.jpg
    Bonds Inflation Periods.jpg
    396.5 KB · Views: 16
What I did not appreciate in my OP was that inflation was not a major factor in those past rate rises. Looking at the charts I posted yesterday you can see how wildly out of control the situation is. No past period shows such an inflation surge for years of low inflation. If it comes down rapidly towards the end of the year as the Fed (I think) hopes, then maybe the past rate ramps data would be useful in selecting bond funds for new money (or a switch).

I certainly don't know how this will play out. As mentioned about I am chickening out and holding Tbills for now.
 
Back
Top Bottom