FIREcalc - Has it measured up all these years?

It is not a Monte Carlo simulator. It doesn't do any kind of random stuff.

This is what happens when you hurry and mess up an edit before hitting submit and leaving the house. I originally remember writing this before I screwed up my edits:

"It is basically a look at many combinations of past results, not a Monte Carlo simulator, ... "

Oops. Must have dragged my cursor before hitting backspace somewhere. :facepalm:
 
I personally do not put much faith in very long ago results because the US and world economy have changed so drastically.

I take the information prior to the Great Depression of the 1930's with a huge grain of salt. Most of my analysis uses the post WW2 period to plan.
 
It is happening at a time when the stock market is at an all-time high. It is happening at a time when we haven't had a significant bull market in over 10 years. It is happening at a time when interest rates are at an all-time low.

The stock market spends a fair amount of time at all time highs. https://www.thebalance.com/dow-jones-closing-history-top-highs-and-lows-since-1929-3306174

And I don't know what your definition of a significant bull market would be, since I don't think you can get to all time highs without one. I would say having the S&P up around 200% since 2009 would be considered a bull market.

Or maybe that was a typo. Not having a bear market in 10 years would make more sense.

But neither of these points makes any difference with Firecalc. If you use it for the purpose for which it was created, it gives you absolute information. If you are comfortable enough to retire based on the knowledge that your portfolio would survive 95% (or whatever) of the time over the past 130+ years, it has given you that information.
 
The stock market spends a fair amount of time at all time highs. https://www.thebalance.com/dow-jones-closing-history-top-highs-and-lows-since-1929-3306174
Not having a bear market in 10 years would make more sense.
Sorry, that was a typo. Fixed.

But neither of these points makes any difference with Firecalc. If you use it for the purpose for which it was created, it gives you absolute information.

The "absolute information" it gives me is worthless. It tells me, for example, whether I would have been successful had I retired in 1917. Why would I care? I wasn't even born yet.

The purpose of (inferential) statistics is to look at historical data, and use it to make a prediction. If I flipped a coin 1000 times yesterday and got 492 heads and 508 tails, I can make a good prediction about what I will get if I flip the coin another 100 times. A prediction is not certainty - that is understood.

Similarly, when I run FIRECalc, I use it to get a prediction of the likelihood that my retirement - beginning this year, or some other year not covered by FIRECalc - will be successful. I know that this prediction is not certainty, however it is still meaningful.

If you're actually claiming that you ran FIRECalc to see what would have happened had you retired 50 years ago (the purpose for which it was created) - that seems like a pretty pointless exercise.
 
If you're actually claiming that you ran FIRECalc to see what would have happened had you retired 50 years ago (the purpose for which it was created) - that seems like a pretty pointless exercise.

No, of course not, and I'll thank you to not put words in my mouth. Running Firecalc will show you that if times are no worse in the future than they have been in the past, you would have a pretty good chance of running or not running out of money should you retire now/whenever. That's all it shows, and that's all it claims to show. It's useful for helping people understand how they would have fared in bad times past or in good times past. It could possibly help a person feel better or worse about their odds should they retire now/in the future. That's it. Obviously nothing will guarantee that things won't be worse in the future, but unless you plan to work until you die you have to pull the trigger at some point. Firecalc is one tool that can help you make that decision. Personally I think it's more useful in helping with the decision not to retire than to retire, but that's extremely useful too.
 
I also like the Fidelity Retirement Income Planner tool. In addition, before we ER'd, we had a financial adviser review our portfolio compared to cash flow needs and confirm what they felt would be a safe spending level.
 
You can.

Your concern along with several others above might be addressed by using the spreadsheet option, which displays the result data for 30 years at a time. You don’t have to look at early data.

Run your results with spreadsheets starting at 1987, 1957, 1927, 1897, 1871 or whatever periods you want to see - and look at exactly what periods failed. You may be surprised, there are some horrible periods way back too.

But again, FIRECALC isn’t predicting the future, it is simply showing how your portfolio would have fared in the past. It’s up to you to decide how that may compare to your actual future. Some here see the FIRECALC shows a 95% success rate at 4% withdrawal rate for their scenario, and conclude they need to limit withdrawals to 3% just to be safe.

If you’re expecting FIRECALC to predict the future you’re misguided, no calculator can predict the future...

Thanks, I'll check that out.
 
The "absolute information" it gives me is worthless. It tells me, for example, whether I would have been successful had I retired in 1917. Why would I care? I wasn't even born yet.
You keep trying to suggest FIRECALC is something it explicitly claims it’s not on page one of the documentation.

Curmudgeon: Asked in post #6 above but again, what methodology do you recommend and use to plan for retirement spending? If you think FIRECALC is “optimistic” and “worthless,” surely you have a better approach for us.

For others reading this thread, here’s yet another good description below. No tool can predict the future (FIRECALC doesn’t claim to), you have to do that. Looking at the past just gives you a potential frame of reference. If you think the future will be worse than any period on the past, just use a lower withdrawal rate than FIRECALC suggests. If you think the future will be much worse, use a much lower withdrawal rate. You’ll have to make adjustments up or down during retirement anyway most likely.

Running Firecalc will show you that if times are no worse in the future than they have been in the past, you would have a pretty good chance of running or not running out of money should you retire now/whenever. That's all it shows, and that's all it claims to show. It's useful for helping people understand how they would have fared in bad times past or in good times past. It could possibly help a person feel better or worse about their odds should they retire now/in the future. That's it. Obviously nothing will guarantee that things won't be worse in the future, but unless you plan to work until you die you have to pull the trigger at some point. Firecalc is one tool that can help you make that decision. Personally I think it's more useful in helping with the decision not to retire than to retire, but that's extremely useful too.
 
Last edited:
I've always wondered how many poor elderly souls that are living under a bridge and eating cat food have ruefully said to themselves: "Man, I wish I had run FIREcalc at a 3% withdrawal rate instead of 4%...." :)
 
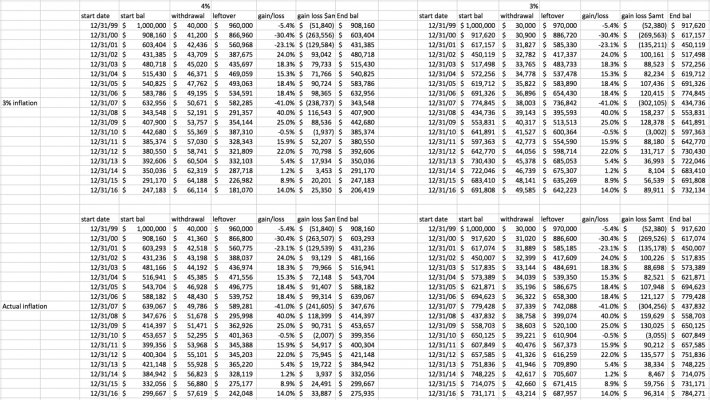
I'm not sure about 2002, but I have a feeling that the cycle that started in 2000 might have the potential to be a failure cycle, at least for me. I ran a few cycles through Excel. They all started with $1M on 12/31/1999. For each year, I used my own personal rate of return. Using 3% inflation and a 4% withdrawal rate, there would be $247K left as of 12/31/2016. Using actual inflation (or at least the numbers I got from an inflation calculator), it would be around $300K. So, needless to say, this cycle wouldn't last much longer. Even though 2017 has been a great year so far, there just wouldn't be enough money left over to generate the gains needed to offset the withdrawals.

Using a 3% withdrawal rate, however, things look better. At 3% inflation, I'd have $692K left as of 12/31/16, and using actual inflation, it would be $731K. And at the rate 2017 is going, the market gains would easily offset the withdrawal.

However, I'd still wonder about the long term viability of 3% in this case. When you add in inflation, that $1M on 12/31/1999 would be around $1.4M on 12/31/2016, so roughly half of the starting portfolio is gone. And the 2017 withdrawal is now $43214 adjusted for inflation. Against a remaining value of $731K, what had started off as a 3% WR is now up to 5.9%. I have a feeling this cycle won't make it 30 years, as is. Of course, throw in social security, a little belt tightening during the lean years, it probably would.

According to my research, 1999 is a bad start year (worse than 2000), but far better than 1966 (the worst) and 1973 (second worst).

-ERD50
 
Here are the results from VPW for retirement at the start of 2000 with a 60/40 portfolio. The low was an inflation adjusted $617k and by the end of 2016 one would have $842k. I modified VPW here to use a 4% constant withdrawal rate.

vpw_1.jpg
 
I'm not sure about 2002, but I have a feeling that the cycle that started in 2000 might have the potential to be a failure cycle, at least for me. I ran a few cycles through Excel. They all started with $1M on 12/31/1999. For each year, I used my own personal rate of return. Using 3% inflation and a 4% withdrawal rate, there would be $247K left as of 12/31/2016. Using actual inflation (or at least the numbers I got from an inflation calculator), it would be around $300K. So, needless to say, this cycle wouldn't last much longer. Even though 2017 has been a great year so far, there just wouldn't be enough money left over to generate the gains needed to offset the withdrawals.

What AA are you using in this analysis?
 
What AA are you using in this analysis?

I've been pretty much all in stocks and mutual funds for my whole investing timeframe. Not much in bonds, CDs, cash, etc. I don't know the percentage that was equities, but probably 90% or more over the years. So I've had some pretty wild swings. Anyway, I attached a screen shot of the graphs below; hopefully it shows. The numbers I mentioned in my earlier post were as of 12/31/16, but these graphs show 2017 as well. At the time I made them, I was up about 14% for the year, but we'll see how it closes out...
 

Attachments

  • Screen Shot 2017-11-14 at 10.45.47 AM.jpg
    Screen Shot 2017-11-14 at 10.45.47 AM.jpg
    747.3 KB · Views: 53
I've been pretty much all in stocks and mutual funds for my whole investing timeframe. Not much in bonds, CDs, cash, etc. I don't know the percentage that was equities, but probably 90% or more over the years. So I've had some pretty wild swings. Anyway, I attached a screen shot of the graphs below; hopefully it shows. The numbers I mentioned in my earlier post were as of 12/31/16, but these graphs show 2017 as well. At the time I made them, I was up about 14% for the year, but we'll see how it closes out...

It would be interesting to run your analysis at different AA figures to see how things would change. We know that being almost entirely in stocks starting in 1999 would be devastating looking backwards, but most of us are not that aggressive investors.
 
You keep trying to suggest FIRECALC is something it explicitly claims it’s not on page one of the documentation.

I've done no such thing. My point was simply this: Firecalc prints out, as a one-number takeaway, the percentage success rate. People use this to infer what their probability of success will be. But the conditional probability of success (the statistic that is used when we know something about the current conditions) is different from what FC prints out, and my contention is that under current economic conditions, your conditional probability of success is probably less than what FC is showing as a success rate.

Curmudgeon: Asked in post #6 above but again, what methodology do you recommend and use to plan for retirement spending? If you think FIRECALC is “optimistic” and “worthless,” surely you have a better approach for us.

I use FireCalc and iORP, mainly. But, as I said, I don't think the percentage success rate is one that people should infer applies today.
And I never said FC is "Worthless", so I'll thank you not to misquote me. What I said was that the "absolute information" - a term someone else used, and which I think was meant to indicate that FC is only meant to predict past results, and should not be used to infer future performance - is worthless to me. Because I don't care whether someone who retired in 1917 was successful or not. I care about the PROBABILITY that MY retirement, which began in 2016, will be successful.

You guys seem so insistent on harping that "you're using it wrong!!!" that I think you're missing my point. So, I'm done here - this is getting too much like wrestling a pig, and the pigs are having more fun than I am.:greetings10:
 
I've tried every financial calculator that I find. I don't fully trust or rely upon any.

I had two larger concerns. Are they potentially biased, making assumptions allowing fund families post rosier projections. This subtly entices people to invest with them. Sales data is cherry picked, why not calculators?

Limited data on my choices of investments means that I can only make wild guesses for the assumptions made by that calculator. I keep a larger fraction of my portfolio in foreign funds. World wealth is proportionally higher, which affects geographic bias risks. Data however is sparse.

Our final choice was to deliberately err in the conservative side by 2X. This meant putting pulling the plug came later, but has a safety factor built in. 2X sounds like a lot, but in a few years of good returns, our investments and contributions compounded and doubled our investment.

edit add: The calculators now seem better than I feared. fireCalc has one easy to use feature in choosing different variable withdrawal methods. I really liked that feature.
 
Last edited:
I've done no such thing. My point was simply this: Firecalc prints out, as a one-number takeaway, the percentage success rate. People use this to infer what their probability of success will be. But the conditional probability of success (the statistic that is used when we know something about the current conditions) is different from what FC prints out, and my contention is that under current economic conditions, your conditional probability of success is probably less than what FC is showing as a success rate.


I use FireCalc and iORP, mainly. But, as I said, I don't think the percentage success rate is one that people should infer applies today.
And I never said FC is "Worthless", so I'll thank you not to misquote me. What I said was that the "absolute information" - a term someone else used, and which I think was meant to indicate that FC is only meant to predict past results, and should not be used to infer future performance - is worthless to me. Because I don't care whether someone who retired in 1917 was successful or not. I care about the PROBABILITY that MY retirement, which began in 2016, will be successful.

You guys seem so insistent on harping that "you're using it wrong!!!" that I think you're missing my point. So, I'm done here - this is getting too much like wrestling a pig, and the pigs are having more fun than I am.:greetings10:

I get your point.

I'm surprised you haven't been labeled a "market timer" yet in these replies. :D
 
But the conditional probability of success (the statistic that is used when we know something about the current conditions) is different from what FC prints out, and my contention is that under current economic conditions, your conditional probability of success is probably less than what FC is showing as a success rate.

If you look at MC papers that try to model the impact of current conditions (i.e. US market PE and bond yields), I think to maintain the same 5% failure rate, you need to drop the withdrawal rate by maybe 0.5 - 1%. I don't remember the exact number and of course it depends on the specific study.
 
I've tried every financial calculator that I find. I don't fully trust or rely upon any.

I had two larger concerns. Are they potentially biased, making assumptions allowing fund families post rosier projections. This subtly entices people to invest with them. Sales data is cherry picked, why not calculators?

I don't think so. I haven't used them all, obviously, but the big name ones (Firecalc, I-orp, Fidelity, etc.) don't ask what your investments are in, they just ask percentage of asset allocation. If you aren't specifying what funds/stocks/whatever you are investing in, there's no option to cherry pick results to steer you toward particular investments.
 
It is not a Monte Carlo simulator. It doesn't do any kind of random stuff.

I think it does if you select the last option on the Your Portfolio tab.

A portfolio with random performance, with a mean total portfolio return of 10% and variability (standard deviation) of 10%. Assume an inflation rate of 3.00%.

I always considered Firecalc as a “backcaster” and used it along with 2 “forecaster” tools, one from Financial Engines and one from Fidelity to help make my decision on when to retire. The forecaster tools I ran used Monte Carlo simulation to generate random data looking forward while Firecalc used historical data to see how I would have fared in the past.

Only 7 years into retirement but so far so good and this year we are both now eligible for SS so have extra income streams available.

+1 assuming the default option under Firecalc.
 
I do like Firecalc, but I wish it included a few more asset types that it doesn't currently have. There are sources for them pretty far back in time which are now used for the updated Simba's spreadsheet over at bogleheads.
 
I do like Firecalc, but I wish it included a few more asset types that it doesn't currently have. There are sources for them pretty far back in time which are now used for the updated Simba's spreadsheet over at bogleheads.

Sadly FC has more potential then it currently provides. It badly needs an update, especially in the area of output summary.
 
My point was simply this: Firecalc prints out, as a one-number takeaway, the percentage success rate. People use this to infer what their probability of success will be. But the conditional probability of success (the statistic that is used when we know something about the current conditions) is different from what FC prints out, and my contention is that under current economic conditions, your conditional probability of success is probably less than what FC is showing as a success rate.

All models are wrong; some models are useful. FIRECalc is a model like any other. At the end of the day, you roll the dice and take your chances.
 
I ran/run Firecalc along with a Montecarlo simulator. They are both tools that help me make a better decision. Not a perfect decision, but a better one.

Want certainty? Wait until I get the part I need to repair my Time Machine. That will be a bit of a wait since temporal matrix de-morgrifiers weren't even invented until 2132. Then we can zoom through the years and see exactly what will happen from 2017 on. :D
 
Back
Top Bottom