Is this rally for real?

I still have my yucky financials and few other dividend stocks which have crashed and burned.

I hope my stocks are merely singed at the edge but not burnt to a crisp. :(

What does one do with ashes?

PS. Ok, Ok, I'll admit that some of them got more than singed. :(

But I am holding them still. Darn, only if I have steady income like when I was still working. So many cheap stock...
 
What does one do with ashes?

You spread those ashes on your 1040 every year and watch more money magically appear in your refund check! :D

Anybody want to buy some 10 year old lucent ashes? I'll sell it to you for 2% of what I bought them for...
 
Well, Lucent merged with Alcatel and the combined company is still trading. So, it is technically not ashes at $2.10/share. I got out last year at $6.13. Don't want to look up how much I paid.

No, I am talking about bankrupcy. Exactly $0.00! And having bought in brokerage accounts, I do not even have the stock certificates to keep as "souvernirs". The like of Calpine, Global Crossing, Copper Mountain, Federal Mogul, etc... Got plenty of my own.

I just realized I do still have 17 shares of ALU worth around $36. Cost basis is close to $5000. After a sales commission, I would net $25. So I'll round down to zero and call those ashes! These ashes are worth a lot as tax write offs to either offset ordinary income up to $3000 a year, or to offset capital gains. Sometimes these things linger at fractions of cents per share. You can either sell them (if there is still an active market) or call up your broker and have them declared worthless and then record them as a loss on that year's taxes.
 
I have "harvested" all of them for tax losses since the 2000-2003 stock meltdown. Have used up all the cap losses when rebalancing in 2007 and offset cap gains. Then, have just generated a ton of cap loss again.

I also have lots of ashes in IRA (roll-over 401k). No tax write-offs there.
 
Lots of headwinds, but the earnings comps will start getting easy, especially in 3Q. Maybe my crystal ball needs a fractal antenna...

The long-awaited quarterly report from Alcoa was released after market close today to kick-off the earning season. Still losing money, but both top and bottom lines were better than expectations. Stock up in after-hour trading. Will see if the market reacts positively tomorrow. Buy, buy, buy...

By the way, I just learned that China's current consumption is 35% of the aluminum production of the world.
 
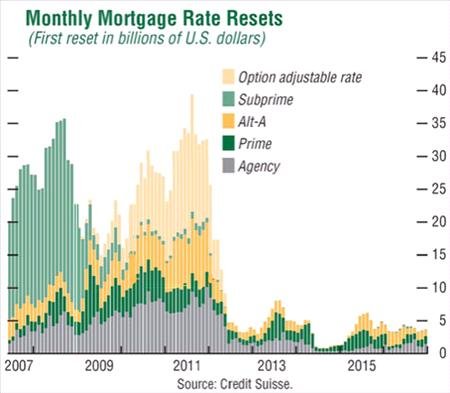
there are supposed to be another big wave of foreclosures starting soon
 
there are supposed to be another big wave of foreclosures starting soon
The ugliest thing about deleveraging is that it feeds on itself as long as there are leveraged assets whose value won't stop falling. It's a snowball rolling down hill with the bottom of the hill nowhere to be seen.
 
So, how 'bout an update on this "market's headed down" prediction. Seems to me the forecast has missed twice - so I'm looking forward to the latest outlook. :)
 
So, how 'bout an update on this "market's headed down" prediction. Seems to me the forecast has missed twice - so I'm looking forward to the latest outlook. :)

Either that forecast will be drastically right or drastically wrong at this point. The best part of maintaining a "this market is headed down" prediction is that you can't be proven wrong. It could always drop tomorrow or next month or next year and prove you right. Do we call the drop during june/july a validation of the prediction, or just a lull in the march upwards?
 
there are supposed to be another big wave of foreclosures starting soon
Mortgageresets.jpg2008552307small.jpg
This chart may have been posted before, but if true, is cause for concern.
 
Either that forecast will be drastically right or drastically wrong at this point. The best part of maintaining a "this market is headed down" prediction is that you can't be proven wrong. It could always drop tomorrow or next month or next year and prove you right. Do we call the drop during june/july a validation of the prediction, or just a lull in the march upwards?
Well, to be precise, the most recent forecast was 6/16

First, can you repost your graph? It shows through market close yesterday. The S&P closed at 911.97 today.

Second, I see it lasting about 4 weeks.
I guess the accuracy of the forecast depends on the meaning of "about 4 weeks". Heck, maybe he was just a bit late (or early - you choose):)
 
Well, to be precise, the most recent forecast was 6/16

I guess the accuracy of the forecast depends on the meaning of "about 4 weeks". Heck, maybe he was just a bit late (or early - you choose):)

Well, er, ah, these prediction things can be difficult. Just wait - the forecast that the market will go down will eventually be proved right. It just may go up a bunch first. :D

Still 100% equities...
 
Well, er, ah, these prediction things can be difficult. Just wait - the forecast that the market will go down will eventually be proved right. It just may go up a bunch first. :D

Still 100% equities...

Oh!! I knew my crystal ball would come in handy. Let me see... looking deep into the swirling depths within my crystal ball, let us divine what the future may hold... Aha! the market is going to go down a little, then mostly up. Maybe. Some people will buy, some people will sell.
 

Attachments

  • crystalballsml.jpg
    crystalballsml.jpg
    14.1 KB · Views: 129
I'm still too lazy to post a new graph but the results of the second prediction by TheSweetLife of a market decline over the four weeks ending July 16 was no more accurate than the first prediction of same.

First four weeks the S&P was flat, going from 910 to 912.
The second four weeks saw the S&P move up slightly from 912 to 933.

TSL, perhaps you should see if W2R will make you a deal on her spiffy new crystal ball. Yours is apparently defective. :cool:

Well, unfortunately, you hold me to "exact" days...the 16th to the 16th. I don't think too many people would predict that correctly. I believe it dropped to 880 around the 10th. So, there was a 3.5% drop during that time. I'll stick with my plan...it worked for me last year. Still holding onto my inverse ETF and plan to make a bundle on it. Not holding me to exact dates....I see the S&P dropping at least 20% by October. Ahhhh, the power of the crystal ball :D:D
 
Well, unfortunately, you hold me to "exact" days...the 16th to the 16th
This is a problem for forecasting – it would be so much easier if it weren’t for that totally unreasonable demand for exactness – otherwise known as accuracy.

I see the S&P dropping at least 20% by October
So, does that mean sometime between now and october the S&P reaches 752, or does that mean that the S&P hits 752 during october?

I knew my crystal ball would come in handy. Let me see... looking deep into the swirling depths within my crystal ball,
Hands, balls, swirling depths ... I can think of so many inappropriate responses to this post, but not one that would be moderator-safe ...:)
 
I see the S&P dropping at least 20% by October.

Well, third time is the charm. Maybe 1 out of 3 predictions ain't so bad (if this third one comes true). But caution that if you are wrong again, you may just establish yourself as an excellent contrary indicator.
 
The cumulative job losses over the past six months have been greater than for any 6 month period since World War II. Job losses are now equal to the net job gains over the previous nine years, making this the only recession since the Great Depression to wipe out all employment growth from the previous business cycle.

This is not the foundation of which a short severe bear market with a quick sharp recovery is based on. This rally certainly feels like a bear market rally to me, quick to the upside and rapid so that investors feel they are missing the recovery.

With so many workers losing jobs and those that are working benefits and hours reduced the debt burden remaining is continuing to be too large to service in many areas. The cannon shot of the US government's defict spending has been fired and the direction of the market will be determined by what is sighted once the smoke has cleared. But the fundamental cash flow for the average worker to service their debt load is becoming more onerous.

Dividends of companies are being cut so rapidly that the prices that the yields of stocks can justify with the reduced future growth prospects Quoting Helicopter Ben from today:
The pace of recovery is critical to a sustained expansion, economists said. One risk is that the economy grows several quarters below a rate needed to absorb a growing labor force. That would result in even higher unemployment and possibly weaker income growth, stalling demand and cutting the inventory cycle short.
“Job insecurity, together with declines in home values and tight credit, is likely to limit gains in consumer spending,” Bernanke said. “The possibility that the recent stabilization in household spending will prove transient is an important downside risk to the outlook.”

I do not see how there can be much growth in dividend prospects for stocks and therefore for prices in such an enviroment and a slow growth enviroment for dividends does not portend well for an S&P500 with a dividend yield of 2.33 percent.

Near term indeed the market can move up as the expectation of recovery continues to be sold by Wall Street and business in general, but actual conditions are deteriorating with every passing month. The cutting of 401K matching contributions is every bit a cut in salary that goes unreported - a study by Grant Thorton indicates 29% of all companies are planning on cutting or have cut that benefit this year.

Report: Employers cut 401(k) match - The Business Journal of Milwaukee:

I find the odds much more favorable that there will be a second very major leg down in both the stock market prices and the economic times as well. The federal government can only buy so many hams for it's citizens.
 
As of now, there is approximately 15,000,000 Americans unemployed, the market has declined considerably since 2007, and home prices have plummetted. All 3 of these factors affect the average person's net worth. We are a consumer-driven economy. The consumers are saving more and spending less. I agree with Running Man that the conditions are continuing to deteriorate month by month.

To clarify my previous prediction....I see the S&P declining at least 20% sometime between now and October 31, 2009.
 
To clarify my previous prediction....I see the S&P declining at least 20% sometime between now and October 31, 2009.

"Sometime"? Well, now. ("Sometime"?) And declining 20% from what?

After consulting my crystal ball, I can do better than that. I can definitively predict that the S&P500 will double from today's value of 954.58 "sometime" in the next 40 years....
 

Attachments

  • crystalballsml.jpg
    crystalballsml.jpg
    14.1 KB · Views: 140
After consulting my crystal ball, I can do better than that. I can definitively predict that the S&P500 will double from today's value of 954.58 "sometime" in the next 40 years....

I'll go further and reiterate that prediction, plus suggest that somewhere along that path there will be corrections from time to time.
 
Back
Top Bottom