Long-Term Market Returns

Starsky

Full time employment: Posting here.
Joined
Dec 6, 2016
Messages
572
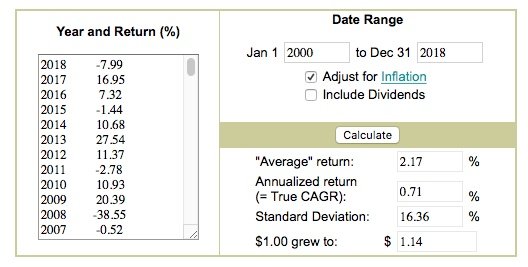
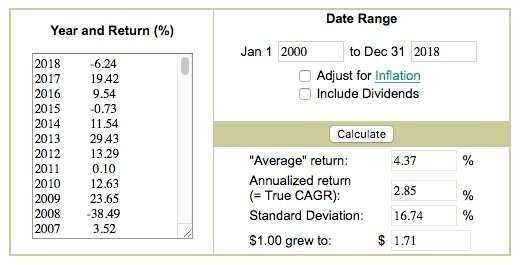
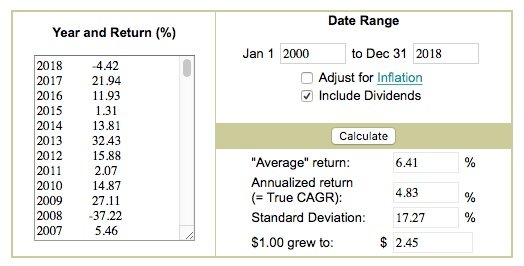
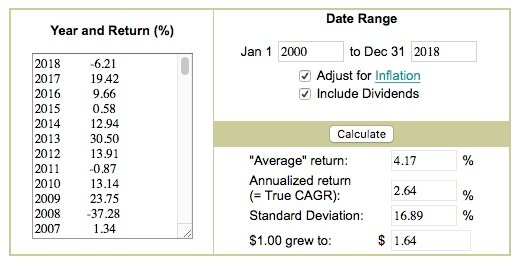
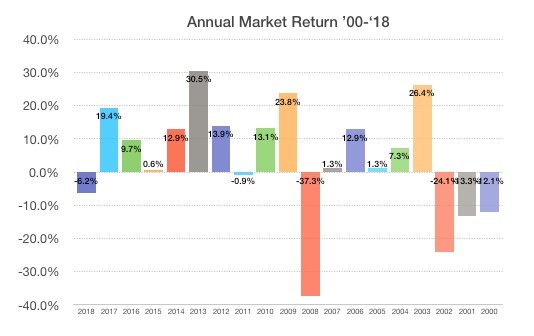
I have been running some long-term financial scenarios that required me to input a future average market return for my model. Looking at the past results was very surprising, and validated my assumptions about the last 20 years, especially given that most articles seem to think the average return is in the 8-10% range historically. I'm not sure whether to focus on the numbers or the chart. They give rather different perspectives on the average over time.

It looks like a 5% return would be considered excellent in this environment, but 2008 obliterated the average and it may not be as excellent as it seems. For now, I think I'll use 4% as my conservative average - half of the historical return - since my time scale is 40 years and it's impossible to predict anything out that far. I'd be interested to hear what number others use for long-term forecasting - or how you approach it over such a long term.

Here's the calculator: Annualized Return Calculator

The chart is mine, from the data on the website.
 

Attachments

  • Scenario 1.jpeg
    Scenario 1.jpeg
    52.5 KB · Views: 116
  • Scenario 2.jpeg
    Scenario 2.jpeg
    49.9 KB · Views: 96
  • Scenario 3.jpeg
    Scenario 3.jpeg
    50.6 KB · Views: 94
  • Scenario 4.jpeg
    Scenario 4.jpeg
    50 KB · Views: 92
  • Scenario 5.jpeg
    Scenario 5.jpeg
    38.4 KB · Views: 103
Last edited:
I use ETF's VYM and VYMI, split 50/50, which are Vanguard's High Dividend Yield Indexes.

My withdrawal strategy is to only spend the dividends. So I base my growth rate on the dividend growth and not the total return growth rate.

My guess is that yearly dividend growth will be around 6% to 8% on average.

A good resource for looking up the dividend growth rate is Seeking Alpha.

Ten year avg growth rate per year on VYM is 6.26%.

One year avg growth rate per year on VYMI is 11.53%.

https://seekingalpha.com/symbol/VYM/dividends/dividend-growth

https://seekingalpha.com/symbol/VYMI/dividends/dividend-growth


There are other good dividend growth ETFs out there that I might add in as well.

https://seekingalpha.com/symbol/SCHD/dividends/dividend-growth

https://seekingalpha.com/symbol/REET/dividends/dividend-growth

https://seekingalpha.com/symbol/IQDF/dividends/dividend-growth

https://seekingalpha.com/symbol/SPHD/dividends/dividend-growth

https://seekingalpha.com/symbol/EMFM/dividends/dividend-growth

https://seekingalpha.com/symbol/VIG/dividends/dividend-growth

https://seekingalpha.com/symbol/FM/dividends/dividend-growth
 
Last edited:
Looking at the chart above reminded me of how terrible the market return was after the burst of the tech and dotcom bubble, in the years of 2000, 2001, and 2002.

Indeed Morningstar shows that $10,000 invested in the S&P on 1/1/2000 became $6229 on 12/31/2002.

The market bounced back somewhat for 5 years, just to get devastated in 2008. No wonder they call 2000-2010 the "Lost Decade".
 
Last edited:
I completely agree that future returns should not be expected to match the past long term figure in the 8-10% range. Most of the long term drivers of economic growth have weakened with little prospect of change - population growth, productivity growth, and economic development. For example, much of the growth in the world economy over the last 30 years came from the expansion in China, which cannot be matched again on a proportional basis. It all means that the future will not mirror the past, so 4-5% return is a fair estimate.
 
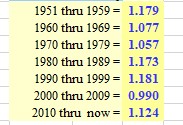
From Jan 1951 to now the SP500 return (plus dividends) was 10.8%.

Here are the returns for each decade. To read the returns remove the leading "1" and shift the decimal place over 2 digits, i.e. 1.179 becomes 17.9% CAGR.
Capture.jpg


Note these returns are before inflation and taxes.

That was then. The future?

FWIW, my personal opinion is buy-hold is not going to be easy over the next decade.
 
Looking at the chart above reminded me of how terrible the market return was after the burst of the tech and dotcom bubble, in the years of 2000, 2001, and 2002.

Indeed Morningstar shows that $10,000 invested in the S&P on 1/1/2000 became $6229 on 12/31/2002.

The market bounced back somewhat for 5 years, just to get devastated in 2008. No wonder they call 2000-2010 the "Lost Decade".

As a young lad in my 20s, lord knows I felt lost. Livin with parents in and out until about 25 lol. No way I was able to find a job with 401k...when I did I never looked back!
 
I factor 6%. I mean, how low can you go. Reasons are shrinking labor force due to automation, glowing globalization wage risks, inflation etc.
 
I Bonds 2001 5.76% Somewhat less for the next two years. For 2003, 4.70%

In the years when the purchase limit per person was $30,000.
 
Great feedback folks. Thanks! It's all a big guess, but 4% is looking better and better.

One wonders what 2016 and 2017 would have looked like without the stock buybacks...

No, it's not going to be easy moving forward.
 
From Jan 1951 to now the SP500 return (plus dividends) was 10.8%.

Here are the returns for each decade. To read the returns remove the leading "1" and shift the decimal place over 2 digits, i.e. 1.179 becomes 17.9% CAGR.
Capture.jpg


Note these returns are before inflation and taxes.

That was then. The future?

FWIW, my personal opinion is buy-hold is not going to be easy over the next decade.


If we take the above numbers and subtract out inflation, we see 1970-1979 as a bleak decade particularly with high inflation. The Lost Decade of 2000-2009 also stands out clearly.

If the next decade is like 1960-1969, I am happy.

PS. The high inflation of 1970-1979 is such that $1 in 1970 is worth only 49c in 1980. The annualized inflation rate was 7%/year.
 
Last edited:
Just a comment: If the goal is to come up with a planning number, iMO one doesn't want that number to be a good quality estimate of future growth.

Ignoring that obvious fact that no one knows the future, the problem is that the consequences of a "miss" are not symmetric. For an underestimate of future growth, there really is only happiness. But an overestimate of growth could involve considerable pain when expected returns do not materialize.

I think most of us deal with this by deliberately keeping our planning numbers a little low, but the asymmetry is still worth keeping in mind.
 
If we take the above numbers and subtract out inflation, we see 1970-1979 as a bleak decade particularly with high inflation. The Lost Decade of 2000-2009 also stands out clearly.

If the next decade is like 1960-1969, I am happy.

PS. The high inflation of 1970-1979 is such that $1 in 1970 is worth only 49c in 1980. The annualized inflation rate was 7%/year.

In the end, is some inflation really bad? Not talking 70's inflation.
For example, my car insurance premium is slated to go up next year by 20%. This has nothing to do with the current inflation rates, or any accidents, etc...

Thus since most ER don't have debt besides personal mortgage choices, isn't it better to receive some better rates on the fixed income side of the equation which typically goes along with higher inflation.

Personal inflation rate would matter more so......
 
The 4.17% figure would seem to be the real gain, but when looking at past performance most metrics simply measure dollar value increase and don't count inflation, so 6.41% is a better benchmark figure to use for comparison.
 
So, the reason for this analysis is long-term sustainability, and what level of expenses we can tolerate over a long period. I know we're spending more than we take in; but that's why we accumulated $3M+ in NW before retiring.

I want to compare my current returns that are coming from income real estate (7 rental SFRs in Raleigh/Apex, NC) to the returns I could potentially get by taking our investments in cash and RE equity ($2.7M) and converting it into a different vehicle, such as dividend producing stocks, annuities, private equity, etc. (The CAGR value is critical to this analysis, since the difference between 3% and 5% is the difference between net annual cash outflows vs. inflows) My timing couldn't be worse, but this what-if analysis will better prepare us for the future.

The other side of this is to analyze my real-estate returns over time. I believe some of my concerns are emotional, and related to the rising expenses of owning a larger real estate portfolio and seasonal spring turnovers; but I need to organize my data for validation. Turnovers eat into our liquid cash each year to the point I'm considering taking out a LOC against our properties to help manage our annual cash flow better - it ends up being $15-20K/yr. from our cash, mostly during May-Aug. I believe the expenses are ultimately offset by property appreciation, and it's just a matter of how and when to begin converting real estate to cash as we get closer to the [impossible to predict] end. We have no children, and lots of hard assets; so how much we eat into our equity is irrelevant.

I recognize that part of this is a budgeting exercise too, and that's a whole other issue. I take the blame for not keeping a bigger reserve for these events, but historically the repair expenses have been growing in recent years, and so have our own expenses. My current frustrations with Real Estate may ultimately prove minor given the heartache I'd be having in the market right now. However, if the market were able to sustain historical returns, it would blow my rentals away in terms of annual income and net worth over a 25-year span.
 
In the end, is some inflation really bad? Not talking 70's inflation...

Economists generally believe that a bit of inflation is good, something like 2% to 3%. That's what the Federal Reserve Bank tries to achieve.
 
I have been running some long-term financial scenarios that required me to input a future average market return for my model. Looking at the past results was very surprising, and validated my assumptions about the last 20 years, especially given that most articles seem to think the average return is in the 8-10% range historically. I'm not sure whether to focus on the numbers or the chart. They give rather different perspectives on the average over time.

It looks like a 5% return would be considered excellent in this environment, but 2008 obliterated the average and it may not be as excellent as it seems. For now, I think I'll use 4% as my conservative average - half of the historical return - since my time scale is 40 years and it's impossible to predict anything out that far. I'd be interested to hear what number others use for long-term forecasting - or how you approach it over such a long term.

Here's the calculator: Annualized Return Calculator

The chart is mine, from the data on the website.

Looking at the S&P 500 (admittedly not the entire market), the worst 20 year period returned 6.4% per year on average. The best 20 year period returned 18% on average. Given a long time frame, the market does well.

https://www.thebalance.com/rolling-index-returns-1973-mid-2009-4061795

Of course, past performance doesn't predict future performance and naysayers will say that we can't expect the market to continue performing as it has, that the world is changing, etc. Naysayers have always been saying that. What's the alternative? Playing it safe with investments that can't lose money? That is an alternative... but the investments that can't lose money also can't gain much money.

I'm not sure we're in an environment where the differences between investments that make money and those that don't is so obvious. There are times when the search for profits is elusive, and it feels like one of those times. I have my own theories about why Bogle would suggest a period of flat performance, and I personally believe it's partially a function of his popular, but lazy, investment strategy; and related lack of due diligence by ETF investors - arbitrage stops working when everyone adopts an arbitrage strategy. There is little focus on investing in quality beyond the FAANG behemoths.

I think that extreme, targeted diversification is useful, and I feel much better about my investments in PM today, than I did a year ago. Unfortunately, it's a relatively small part of the portfolio, and the big question is how [and if] to re-deploy the remaining assets to be more productive over the next several years? I don't see huge upside in the market until we start to reduce some of these tariffs and resolve other geopolitical frictions that the world is going through.
 
Looking at the S&P 500 (admittedly not the entire market), the worst 20 year period returned 6.4% per year on average. The best 20 year period returned 18% on average. Given a long time frame, the market does well.

https://www.thebalance.com/rolling-index-returns-1973-mid-2009-4061795

Of course, past performance doesn't predict future performance and naysayers will say that we can't expect the market to continue performing as it has, that the world is changing, etc. Naysayers have always been saying that. What's the alternative? Playing it safe with investments that can't lose money? That is an alternative... but the investments that can't lose money also can't gain much money.

I don't know your definition of "naysayers", but the late Bogle warned us for years to temper our expectation of returns of both stocks and bonds. Is he a naysayer?

Bogle never once told us to go buy "alternative" investments like gold or bitcoins. He was just warning us to not expect the high return of stocks and bonds to last forever. Shiller also told young people to prepare to save more to make up for the lower return.
 
Looking at the S&P 500 (admittedly not the entire market), the worst 20 year period returned 6.4% per year on average. The best 20 year period returned 18% on average. Given a long time frame, the market does well.

https://www.thebalance.com/rolling-index-returns-1973-mid-2009-4061795...

From the above Web page:

The S&P 500 Index, shown in bright red, delivered its worst twenty-year return of 6.4% a year over the twenty years ending in May 1979.

I looked up the cumulative inflation of the above 20-year period. It averaged 4.62%/year. This means the real return of the stock market averaged less than 1.8%/year in the above period.
 
Last edited:
From the above Web page:
The S&P 500 Index, shown in bright red, delivered its worst twenty-year return of 6.4% a year over the twenty years ending in May 1979.
I looked up the cumulative inflation of the above 20-year period. It averaged 4.62%/year. This means the real return of the stock market averaged less than 1.8%/year in the above period.

Indeed, that's a very important point. When I plugged the numbers for March 59 to March 79 in here, the result was 1.730% for annualized real returns including dividend reinvestment.


https://dqydj.com/sp-500-return-calculator/
 
I don't know your definition of "naysayers", but the late Bogle warned us for years to temper our expectation of returns of both stocks and bonds. Is he a naysayer?

Bogle never once told us to go buy "alternative" investments like gold or bitcoins. He was just warning us to not expect the high return of stocks and bonds to last forever. Shiller also told young people to prepare to save more to make up for the lower return.

I wouldn't call either of them naysayers. And maybe my remarks are more of a hope that we do continue to see historic returns than any hard evidence.
 
Indeed, that's a very important point. When I plugged the numbers for March 59 to March 79 in here, the result was 1.730% for annualized real returns including dividend reinvestment.

https://dqydj.com/sp-500-return-calculator/

Ah, it does give one a warm fuzzy feeling when different Web sites give the same answer.


I wouldn't call either of them naysayers. And maybe my remarks are more of a hope that we do continue to see historic returns than any hard evidence.

Bogle also warned us that 1980-2000 was a special period with very specific circumstances to give the high return we had then. The circumstances now are the opposite of those, so the expected return cannot be the same. We may see the low range of historical returns, which we just talked about.
 
Last edited:
.... I want to compare my current returns that are coming from income real estate (7 rental SFRs in Raleigh/Apex, NC) to the returns I could potentially get by taking our investments in cash and RE equity ($2.7M) and converting it into a different vehicle, such as dividend producing stocks, annuities, private equity, etc. ....

My concern here would be concentration risk... both geographic and property type. If some calamity happened to the Raleigh/Apex, NC area (think a Flint, MI type event) then a good portion of your wealth could be wiped out because you are not geographically diversified.

Similar risk with single-family homes. I have a concern about this in Florida where we winter.... lots of building in part driven by demographics IMO.. what happens in 20 or 30 years when that demographic bubble has passed? Will supply far exceed demand and values crater?
 
Back
Top Bottom