Texas Proud
Give me a museum and I'll fill it. (Picasso) Give me a forum ...
- Joined
- May 16, 2005
- Messages
- 17,266
Sorry, here's the correct link: http://krugman.blogs.nytimes.com//2013/02/23/austerity-europe-2/
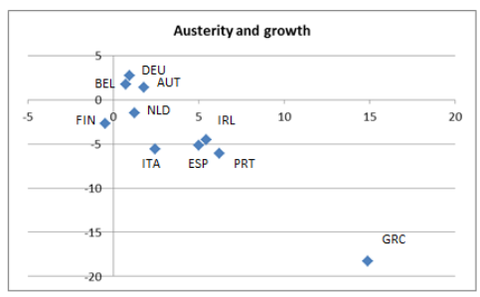
The x axis is the level of austerity. The further to the right you go, the more austerity. The y axis shows how much growth there was from 2009-2012. Greece is so far from the rest of the group because the EU imposed extremely severe austerity as a precondition to the 2010 and 2012 bailouts. But, as the graph shows, this was a self-defeating proposition for EU bureaucrats, since the austerity made it even more unlikely that Greece would be able to make good with its creditors. This is something that many mainstream economists agree with, BTW.
Had to look for it, but found it....

Your argument is that it is horrible, but I say that you are looking at the red line....
I say it was due to unsustainable spending when they joined the Euro, with is the yellow line...
The problem is there was no way for them to keep at a false high level... the major decline is not due to austerity per se, but due to the heady levels they went up to with their unsustainable spending...
They have now adjusted back to their mean level.... and if the current gvmt had not insisted on keeping on keeping on they would have been growing.... I could be wrong, but I think that prior to Jan the Greek economy was growing again... now it will decline much further no matter what happens... with or without a bailout the Greek people are going to be worse off going forward than they would have if this gvmt never came to power...
Oh... and by the way, it was the Greek people who voted them in.... and also the Greek people who voted NO to the help...