Lsbcal
Give me a museum and I'll fill it. (Picasso) Give me a forum ...
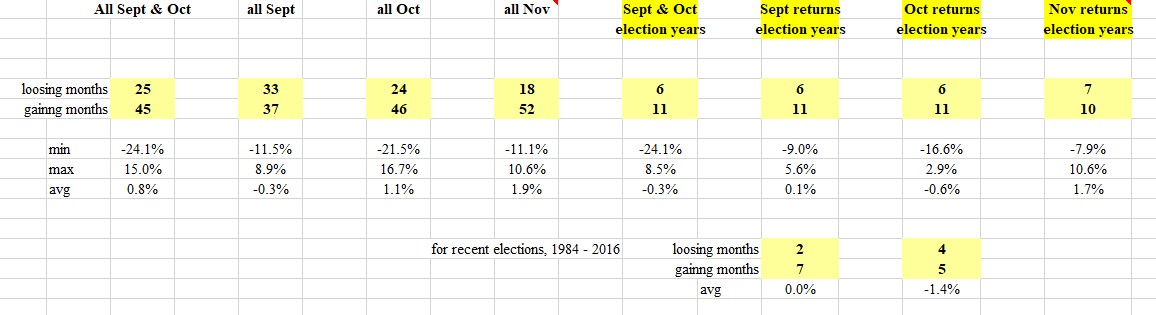
I want to buy more equities in the next few months. But I've heard that September isn't a great month historically. So I did a little looking at the September and October numbers. Below is the table for 1950 to present, 70 years of data. This is for the SP500 with dividends.
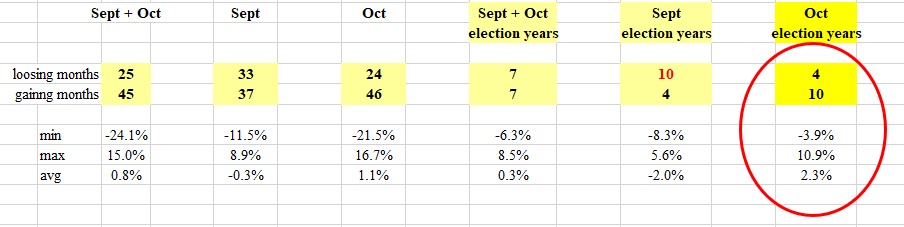
You can see that indeed September has not been all that good. For all Septembers the results are about 50/50 for gains versus losses. On the other hand Octobers have been better with 65% of those months showing gains.
Looking at just election years the numbers are more dramatic. Only 28% of September's showed gains whereas fully 71% of October's showed gains.
I don't know if this is just chance or what. But maybe I will hold off to invest until October.
Thoughts?

 You could try posting a few head-and-shoulders charts or maybe a bump-and-run-reversal !