Hold off to add to equities until October? Some data...

The market will keep going up until Tesla hits $2100. The reason for this is that after the 5:1 split it will be 420, which seems to be the answer to everything.
As long as I get snake jazz and Polynesian elevator music all is well.[emoji854]
 
I'm probably swapping out some US funds for Europe/Asia/Emerging Market (the doom trade over the last 10 years) over the next few months, but I haven't decided exactly what to buy or sell. A non-US index seems appropriate.

I think those markets are priced reasonably, compared to the US, but I"m probably only going to swap about 5% and I usually do this sort of thing slowly (over a year or so). Usually when I do this sort of thing, nothing happens for 2-4 years, then suddenly I seem like a genius (or not). So you'll probably do well trading/investing against me.
 
Last edited:
The market will keep going up until Tesla hits $2100. The reason for this is that after the 5:1 split it will be 420, which seems to be the answer to everything.


The magic number according to the Hitchhiker's Guide is really 42. That corresponds to 210/pre-split share.
 
img]https://i.postimg.cc/y8LkdZL7/image2.jpg[/img]

It's interesting to note that in each of the scenarios, there are more up months than down months. This supports the general belief that it's better to be in the market than out of market.

Hope you are keeping safe.
 
Statistics can be misleading

The data is interesting, but I think one thing that should be plotted alongside it is where the market valuation was, per year, WRT the up and down. There are always qualifiers and more data that links to "getting an answer" (of course, the definition of an open market means you cannot have an answer).

So I would never make a decision based on this...ESPECIALLY when the market(SP500) is at such overvaluation skewed to such few companies.

If you think its going up, average in. You think it's going down but need to invest, try pref's and bonds. As always, IMHO.
 
How many September’s have had a global pandemic and the most divisive election in history? That’s what I thought.
 
All the stats I have seen seem to point out that on average, the best gains occur in November - April and the worst returns occur in May - October. According to the Trader’s Almanac.
 
The market will keep going up until Tesla hits $2100. The reason for this is that after the 5:1 split it will be 420, which seems to be the answer to everything.

Funny - and true.
 
I want to buy more equities in the next few months. But I've heard that September isn't a great month historically. So I did a little looking at the September and October numbers. Below is the table for 1950 to present, 70 years of data. This is for the SP500 with dividends.

You can see that indeed September has not been all that good. For all Septembers the results are about 50/50 for gains versus losses. On the other hand Octobers have been better with 65% of those months showing gains.

Looking at just election years the numbers are more dramatic. Only 28% of September's showed gains whereas fully 71% of October's showed gains.


image1.jpg


I don't know if this is just chance or what. But maybe I will hold off to invest until October.

Thoughts?

16' paid well for those who stayed the course.
 
I think May 22nd 2020 is a good day to buy.
:flowers:
 
Do not look at the data from the OP. It was in error for election years!!! See my more recently posted results which I will repeat in my next post below.
 
Sorry for the delay as we are having fires near here in Northern California and I'm a little distracted.

Well I was thinking of doing the histogram too. So I started into this and 
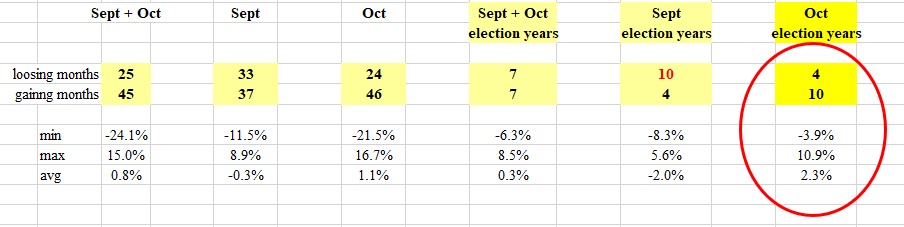
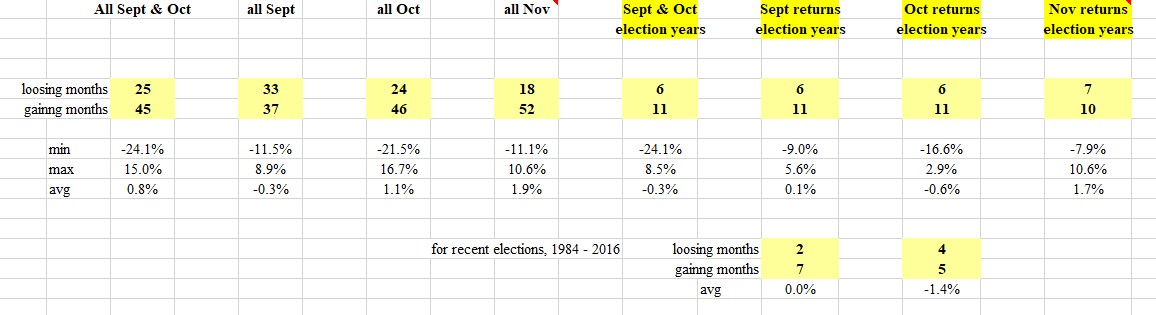
discovered an error which greatly changed my election year results. So here is the revised data which includes the month of November too. Please ignore the OP data, sorry.

You can see that for election years the months of September, October, and November have similar winning and loosing number of months! Interesting that in election years since 1984 (last half of election year data) the September returns have a lot more gaining months then loosing months. Note the 2008 September and October results can affect the data as these months were a -24% loss.

The averages look like nothing special. No "signals" in this data to make a bet one way or the other, I think. This now is not really all that surprising to me but I just think the exercise is interesting anyway.

image2.jpg

Again, do not bother with my original posted data.
 
As it turns out, this(August) would have been the month to buy. I read an article yesterday regarding August results during Presidential election years, which noted that results averaged slightly less than 3% when the incumbent is a Republican and the low 2%'s when a Democrat is the incumbent. We are on track to have the best August in 30 years this year with 1 trading day left.
 
That is why it is kind of hilarious to make predictions based on past market trends when we are in the middle of a global pandemic with massive federal stimulus.

Darts or coin flips is where you should be.
 
That is why it is kind of hilarious to make predictions based on past market trends when we are in the middle of a global pandemic with massive federal stimulus.

Darts or coin flips is where you should be.

Note, I was just looking at the data and sharing it. Not in the predictions game. But also it is interesting to me that the bad rep September has does not come out in this data view.

FWIW, I decided I'm at my limit on stock allocation so will hold steady in the fall.
 
There are certain certainties, but they rarely are certain ... too much up in the air this year for me.

I went a bit defensive about a month ago - and, wish I hadn't, but that is hindsight.

I remain VERY concerned about the bubble in which we find ourselves. Day after day of bad business news, and day after day of increasing stock valuations and stock market movement.
 
I'm confident that I can build a model that works perfectly for the last 70 years worth of election cycle Octobers. It might take 20 or 50 variables, but it would work perfectly on the historical data. The problem is that it would have zero predictive value. Note to self ...
 
I'm confident that I can build a model that works perfectly for the last 70 years worth of election cycle Octobers. It might take 20 or 50 variables, but it would work perfectly on the historical data. The problem is that it would have zero predictive value. Note to self ...
Yes, that is the wonderful thing about backtesting: You really can follow Will Rogers' advice: "If it don't go up, don't buy it."
 
Back
Top Bottom