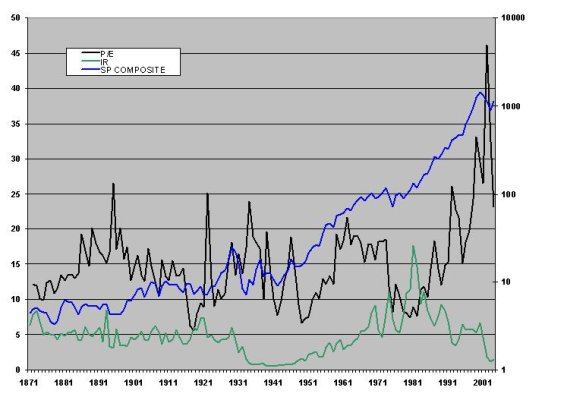
I was wondering if anyone had a good source for charting the S&P 500 (or any other broad-based index of the market...) against its P/E ratio for both the trailing 12 months and also the future/projected 12 months.
I'm a long term buy and hold but thought this would be interesting, especially given recent talk on the board of market timing. 8)
It would also be interesting to chart interest rates against this as well.
Anyone have a good site? I just started searching and am coming up goose eggs.
I'm a long term buy and hold but thought this would be interesting, especially given recent talk on the board of market timing. 8)
It would also be interesting to chart interest rates against this as well.
Anyone have a good site? I just started searching and am coming up goose eggs.