Lsbcal
Give me a museum and I'll fill it. (Picasso) Give me a forum ...
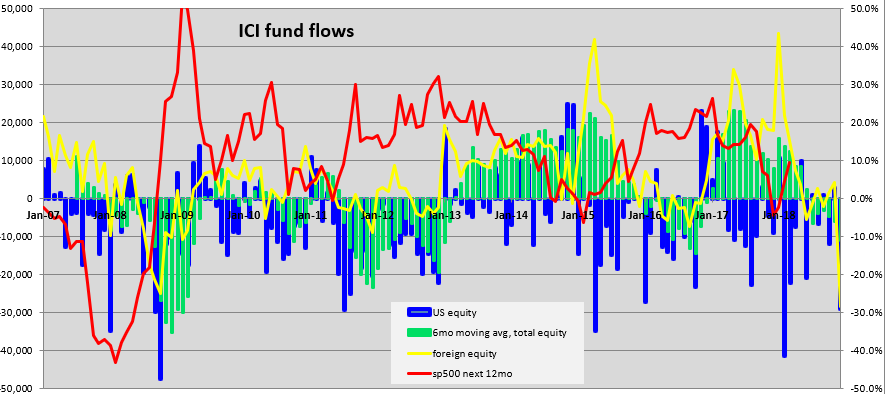
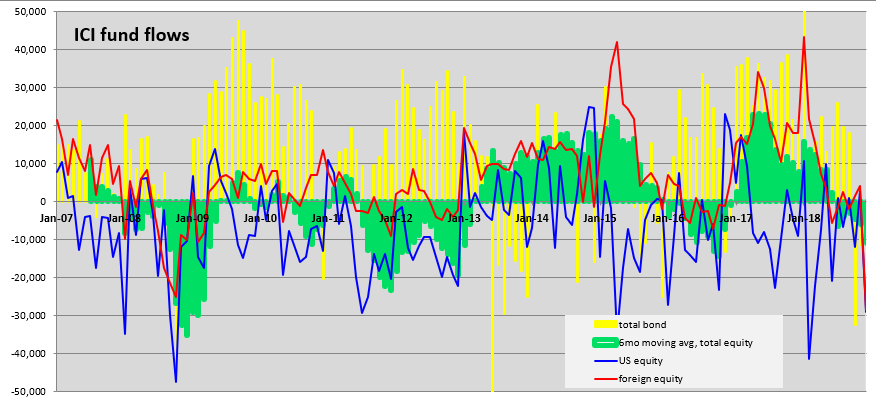
I occasionally update my chart of the ICI funds flow data. Here is the chart up through Feb 2019:
In the thread title I did not mean that the flows were positive but rather the data interpretation is positive IMO.
From this data it looks like we are not in a euphoric stage i.e. the market does not seem to be irrationally exuberant (to me). The 6 month moving average of total equity (US + foreign) is negative. If you think this is a contrary indicator, it's good news for bulls.
Looks like flows are very negative for foreign equity. So maybe at some point foreign funds will pop up?
Last edited: